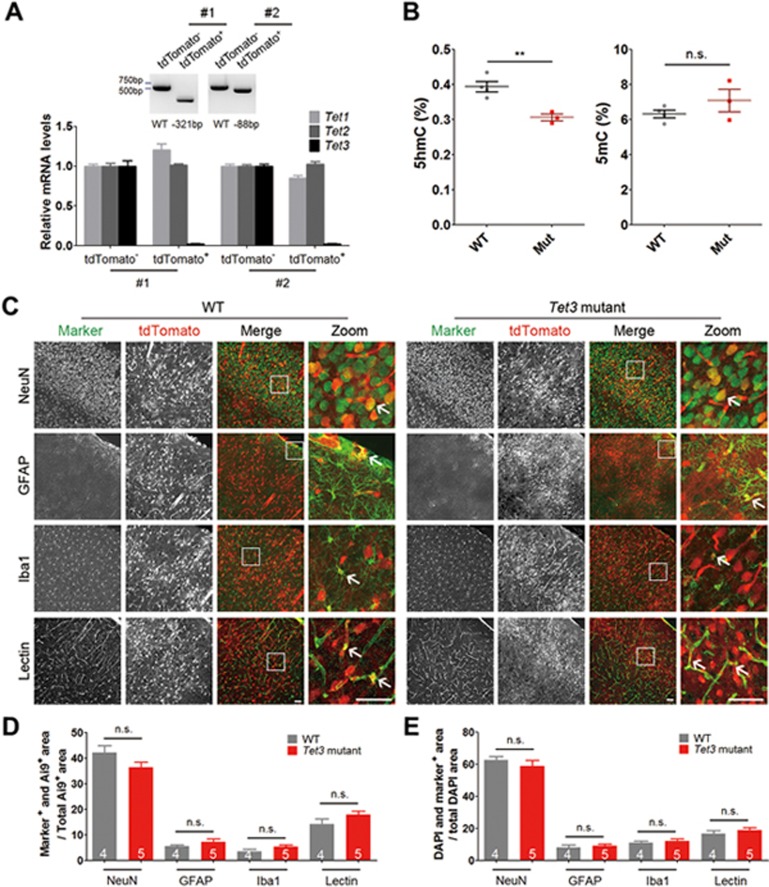
Figure 4.
Loss of Tet3 function does not affect the development of major cell types in the cerebral cortex. (A) qPCR analysis of Tet3 in the cerebral cortex of chimeras. Top, representative genotyping results of two Tet3-mutant mice. Sequencing result of the PCR bands showed that tdTomato− cells were WT, whereas tdTomato+ cells in mouse #1 and #2 carried 321- and 88-bp deletions, respectively. Bottom, relative mRNA levels (normalized to GAPDH) of Tet1, Tet2 and Tet3 in tdTomato− and tdTomato+ cells from the cerebral cortex of Tet3-mutant mice shown in Top. Tet3 mRNA expression was hardly detectable in tdTomato+ cells sorted from the cerebral cortex of Tet3-mutant mouse #1 and #2, whereas Tet1 and Tet2mRNA levels in tdTomato+ cells remained comparable to those in tdTomato− WT cells. Error bars, SD of three reactions. (B) Global genomic levels of 5hmC and 5mC in WT or Tet3-mutant chimeric cortices. Four WT and three Tet3-mutant mice (chimeric rate > 50%) were analyzed by mass spectrometry. **P< 0.01; n.s., not significant, P > 0.05 by unpaired t-test. (C) Representative images of colocalization between tdTomato+ cells and various cell type markers (NeuN, GFAP, Iba1 and Lectin) in brain slices from the somatosensory cortex of WT and Tet3-mutant mice. Arrows indicate colocalization between tdTomato and cell markers. Scale bar, 50 μm. (D) Quantification of the percentage colocalization between tdTomato+ cells and various cell type markers as indicated. (E) Quantification of the percentage colocalization between the nuclear marker DAPI and various cell type markers as indicated. n (4 or 5) as indicated inside bar graphs represents the number of mice, error bars denote SEM; n.s., not significant, P> 0.05 by unpaired t-test.

