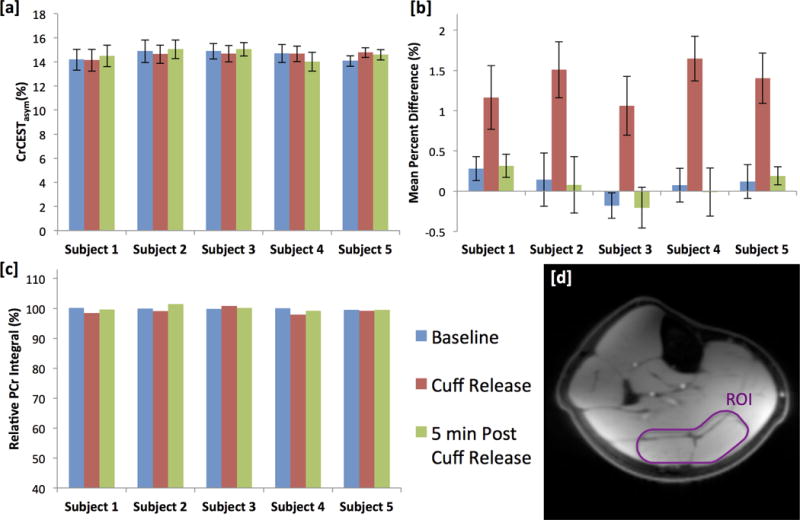
Figure 4.

(a) CrCESTasym, (b) ASL mean percent difference, and (c) relative PCr peak integral values at baseline, immediately following cuff deflation and 5 min post cuff deflation for each of the 5 subjects. (d) Anatomical image of the lower leg. CrCESTasym and ASL mean percent difference measurements were calculated as an average from values in a region of interest (ROI) [outlined in white] for the gastrocnemius and soleus muscles chosen to correspond to the localization of the 31P surface coil which was away from any major vessels. Error bars represent the standard deviation in the CrCESTasym and ASL mean percent difference in the ROI.
