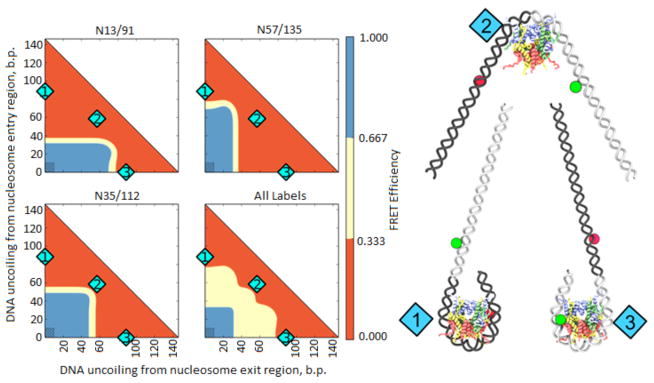
Fig. 4. Analysis of FRET efficiency in unfolded nucleosomes by molecular modeling.
On the left: Color-coded maps of predicted FRET efficiencies for molecular models of labeled nucleosomes with different degree of DNA uncoiling (see Materials and Methods). The red and blue areas on the color maps for all labels correspond to the structures where all three label pairs are in low or high FRET conformations, respectively. Shaded rectangles correspond to native structures, in which conformations are close to those expected from the crystal structure. On the right: Models of nucleosome conformations corresponding to positions numbered in cyan on the graphs.

