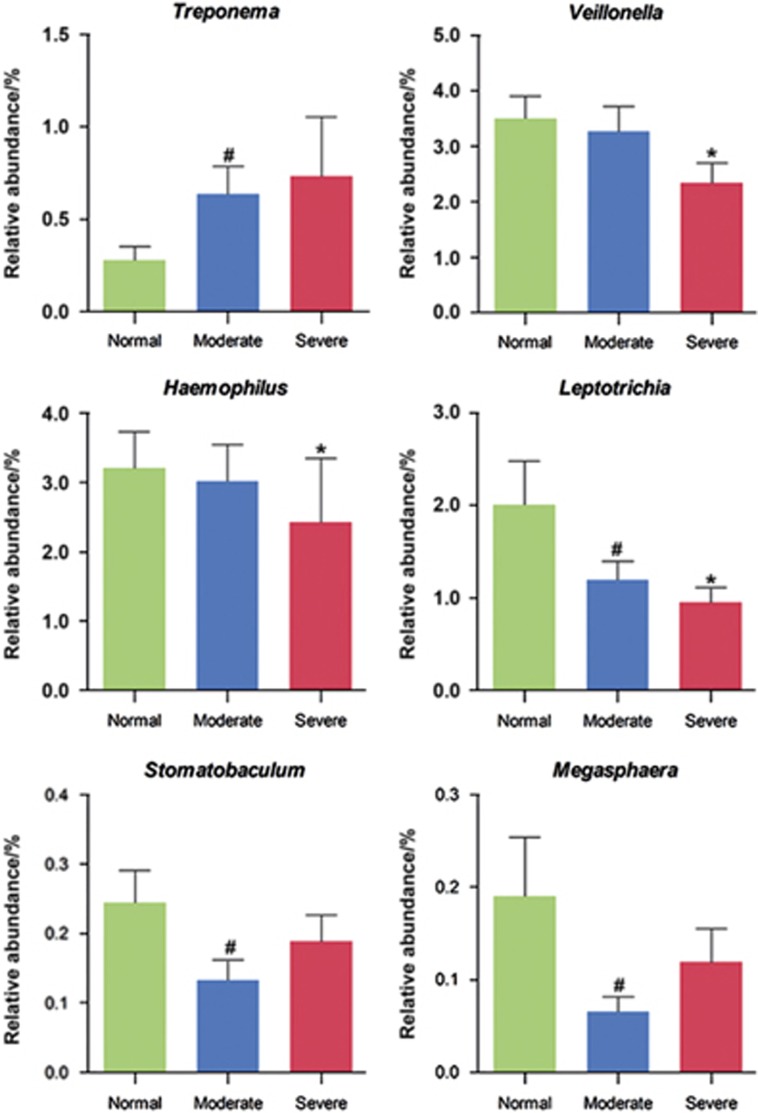
Figure 2.
Genera for which the abundances significantly differed between the groups. ANOVA (one-way) and post hoc least significant difference (LSD) were performed for multiple comparisons between the three different groups. *P<0.05 between severe group and normal group; #P<0.05 between moderate group and normal group.

