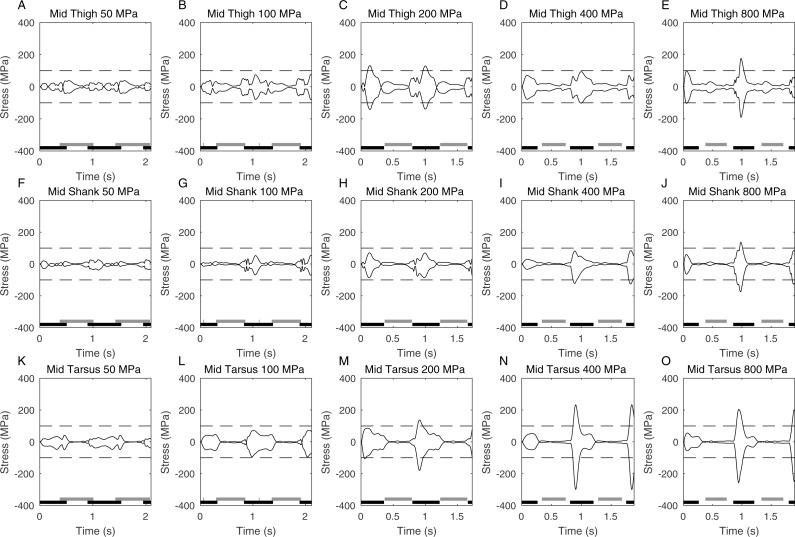
Figure 4. Graphs showing the peak stress (2nd order Butterworth low-pass filtered at 5 Hz) calculated at the functional mid-point of the hindlimb segments at different peak stress cutoffs.
Foot contact times are also shown (black is ipselateral limb, grey is contralateral limb). The time axis represents two complete gait cycles, and the dashed line is drawn at 100 MPa which is the nominal stress limit for a safety factor of 2.

