Figure 1.
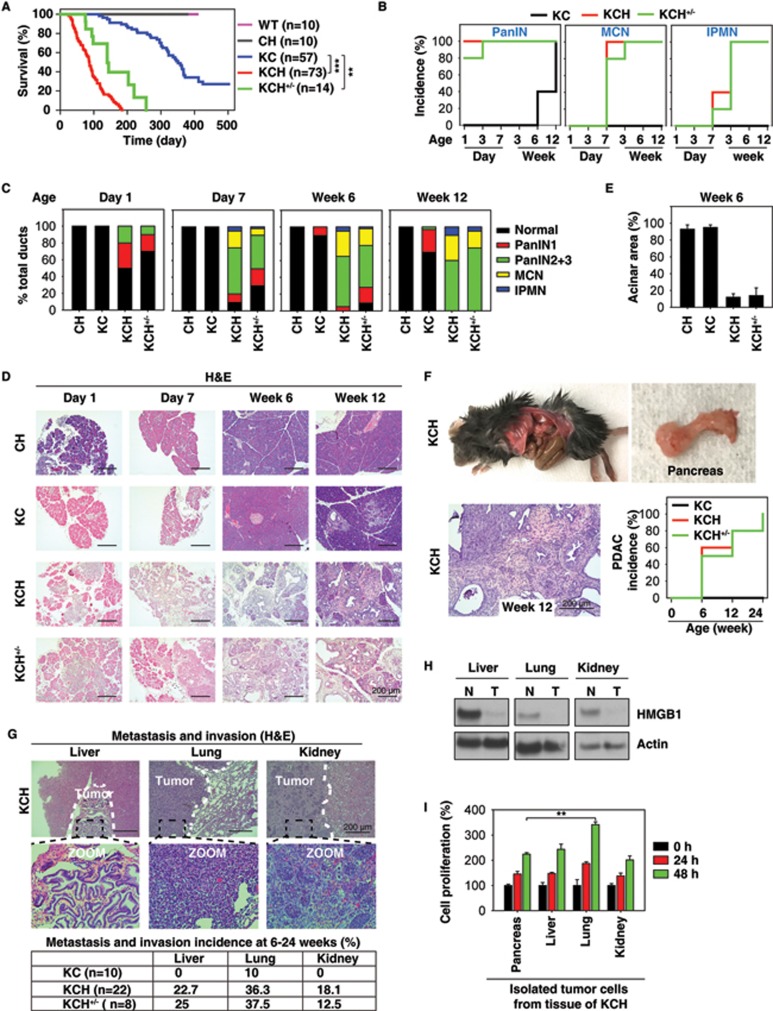
HMGB1 depletion accelerates initiation and progression of K-Ras-driven PDAC. (A) Kaplan-Meier survival analysis was performed in wild type (WT), CH (Pdx1-Cre;Hmgb1−/−), KC (Pdx1-Cre;K-RasG12D/+;Hmgb1+/+), KCH (Pdx1-Cre;K-RasG12D/+;Hmgb1−/−), and KCH+/− (Pdx1-Cre;K-RasG12D/+;Hmgb1+/−) mice (**P < 0.01, ***P < 0.001, log-rank test). (B) Incidence of pancreatic lesions, including pancreatic intraepithelial neoplasms (PanINs), intraductal papillary mucinous neoplasms (IPMNs), and mucinous cystic neoplasms (MCNs) in KC, KCH, and KCH+/− mice at indicated ages (n = 5 mice/genotype /age). (C) Percentages of ductal structures exhibiting normal morphology and indicated neoplastic ducts in KC, CH, KCH, and KCH+/− mice (n = 5 mice/genotype /age). (D) Representative histologic progression of pancreata in KC, CH, KCH, and KCH+/− mice at indicated ages shown by hematoxylin and eosin (H&E) staining (high resolution images shown in Supplementary information, Figure S2). (E) Percentages of intact acinar structures in pancreata from KC, CH, KCH, and KCH+/− mice at six weeks of age (n = 5 mice/genotype). (F) Incidence of PDAC in pancreata from KC, KCH, and KCH+/− mice (n = 5 mice/genotype/age). Representative samples H&E-stained for PDAC with stromal structure shown in right panel. (G) Incidence of tumor metastasis/invasion in KC, KCH, and KCH+/− mice at six to 24 weeks of age. Representative samples H&E-stained for tumor metastasis/invasion to the liver, lung, and kidney shown in upper panels. (H) Western blot analysis of HMGB1 expression in isolated tumor (T) or normal (N) tissue from KCH mice. (I) Cell proliferation analysis of indicated isolated tumor cells from KCH mice (n = 3, **P < 0.01, unpaired t-test).

