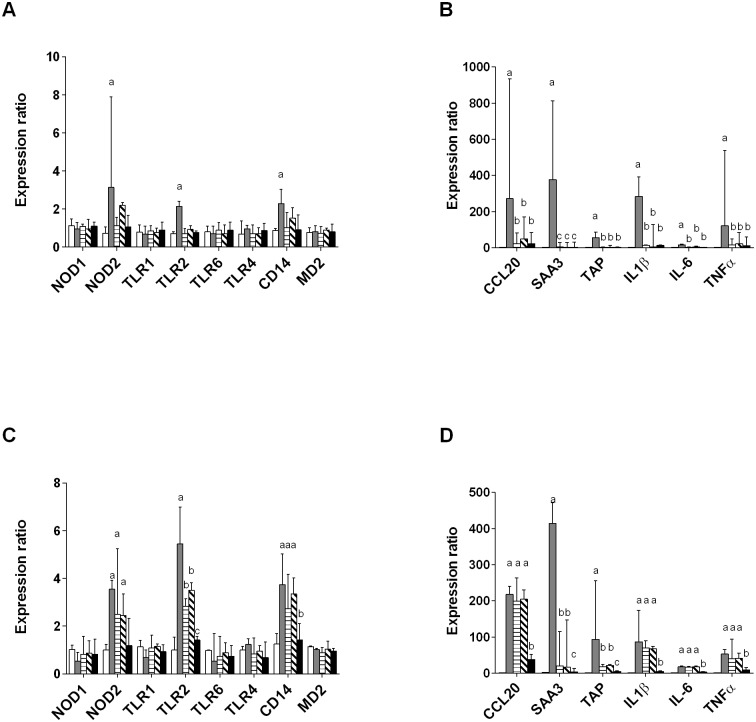
Fig 6. RT-qPCR analysis of the response of PS cells to stimulation by live E. coli strains.
PS cells were incubated for 3 hours with the indicated strains at a MOI of 1 in stimulation medium without rbCD14. Cells were then washed twice with HBSS and medium with gentamicin was added. RNA was extracted 3 h p.i. (A-B) or 8 h p.i. (C-D). Response was analysed by RT-qPCR and values were normalized against expression of 18S, PPIA and BACT as described previously [31]. Strains used were: mock-infected (white bars), MG1655 (grey bars), D6-117.29 (horizontal stripes), B1171 (tilted stripes), P4 (black bars). Data presented are mean values and SD obtained from three independent experiments with stimulations performed in triplicates. For each gene studied, values with different letters are statistically different from the unstimulated cells and from each other (P < 0.05). p-values were calculated using exact permutation tests after global comparison using a Kruskal and Wallis test.

