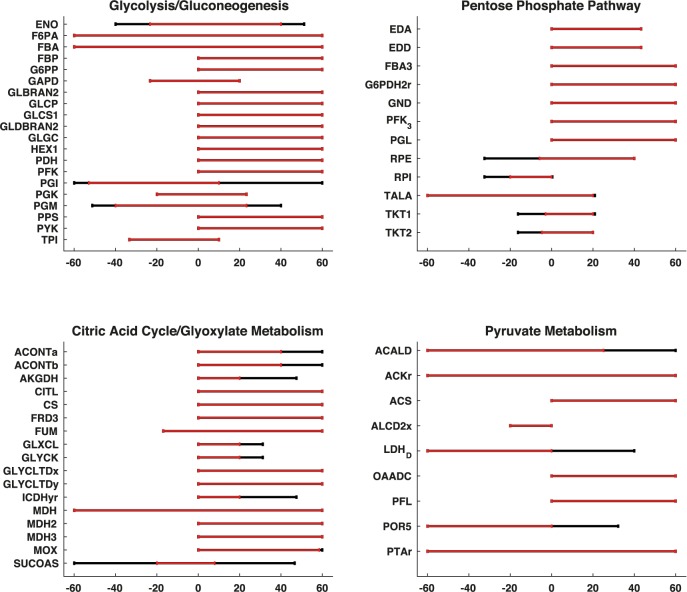
Fig 4. Flux variability of reactions in starting subsystems in D = 1 model compared to corresponding reactions in GEM.
The red lines represents FVA for redGEM, black lines represents FVA for GEM. There cannot be any reaction in rGEM that has a wider range than corresponding GEM reaction. Thus, for the reactions that do not have the black line have the same range for rGEM and GEM. Maximum flux bounds are between -60 to 60 mmol/gDWhr, since the uptake of glucose is fixed to 10 mmol/gDWhr, and the maximum allowable flux in the network cannot exceed 10 mmol/gDWhr times 6, which is the number of carbon in glucose.

