Figure 1.
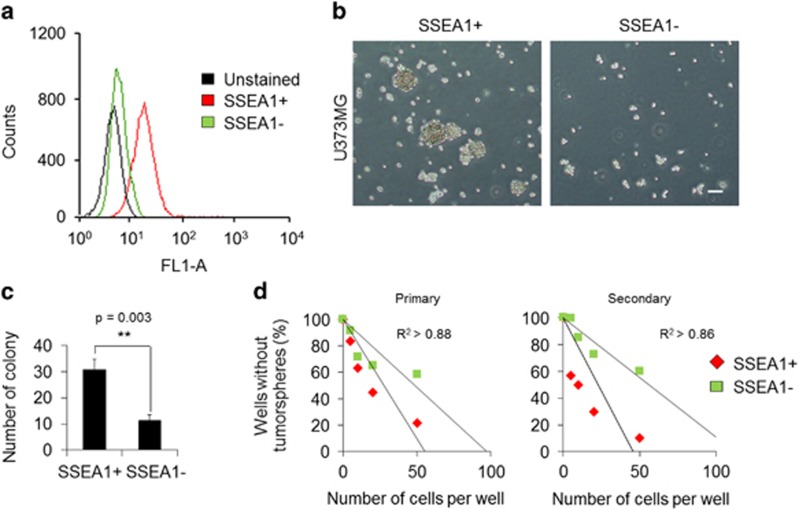
The SSEA1+ population from U373MG glioma cells was more clonogenic than the SSEA1− population. (a) The purity of the SSEA1+ population sorted by immunomagnetic selection was confirmed by flow cytometer. (b) Representative cell morphology of each population three days after cell sorting is shown. (c) Total numbers of colonies were determined in SSEA1+ versus SSEA1− populations using the soft-agar colony-forming assay. (d) Numbers of wells without tumor spheres were quantified in SSEA1+ versus SSEA1− populations using the limiting dilution sphere-forming assay (primary). Serial secondary sphere forming assay was performed (secondary). **P<0.01 (Student’s t-test). Scale bar=50 μm.

