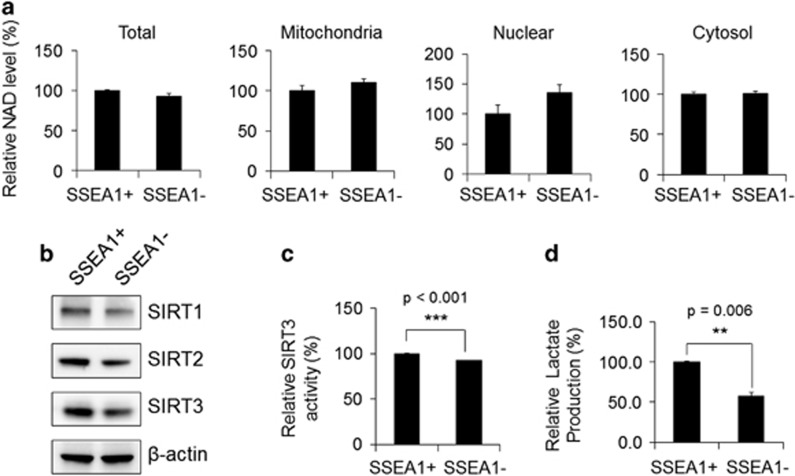
Figure 2.
Nicotinamide adenine dinucleotide (NAD+) levels, SIRT3 expression and activity, and lactate production in SSEA1+ and SSEA1− populations from U373MG glioma cells are shown. (a) SSEA1+ and SSEA1− populations were sorted from U373MG glioma cells (total, unfractionated) and then fractionated into mitochondrial, nuclear and cytosolic fractions. The NAD+ levels in each lysate were quantified. (b) Western blot analysis of SIRT1, 2 and 3 in total protein of each subpopulations. β-Actin was used as an internal control. (c) SIRT3 enzyme activity and (d) lactate contents in each population were determined. **P<0.01; ***P<0.001 (Student’s t-test).

