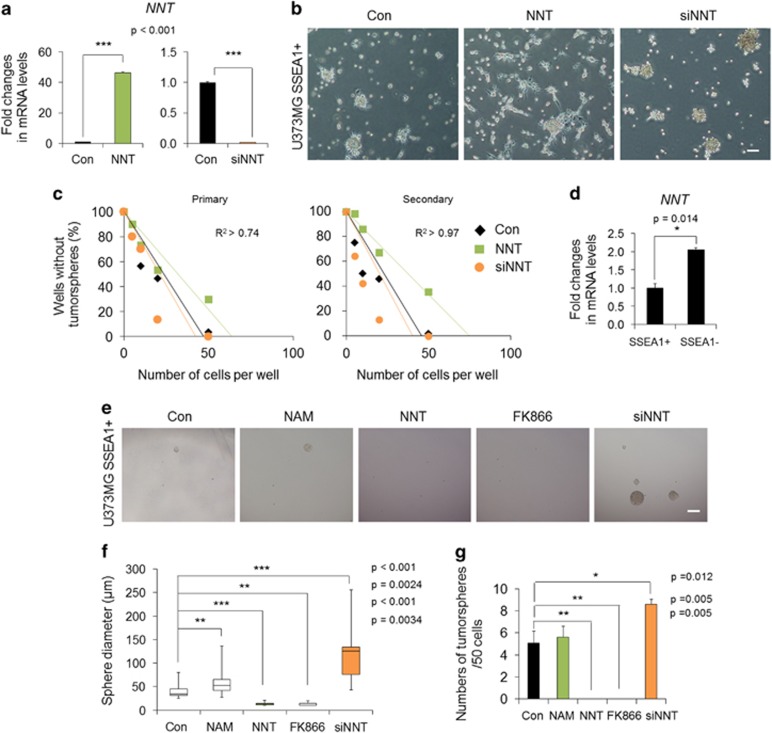
Figure 4.
The effect of nicotinamide nucleotide transhydrogenase (NNT) overexpression or knockdown on clonogenicity of SSEA1+ tumor-initiating cells (TICs) is shown. (a) U373MG SSEA1+ cells were sorted and then transduced with retroviral NNT or transfected with short interfering RNA for NNT (siNNT). Overexpression or knockdown of NNT was confirmed by real-time PCR analysis. (b) Representative morphology of each population at 3 days after treatment is shown. Scale bar=50 μm. (c) Clonogenicity of each condition was compared using primary and secondary limiting dilution analysis. (d) Basal expression of NNT in each subpopulation was examined by real-time PCR analysis. (e) Representative sphere images, (f) the diameter of spheres, (g) sphere numbers per well (initial seeding number=50 cells) in each condition were quantitated at the end point of the limiting dilution analysis (4-week incubation). Box plots indicate the median and 25th and 75th percentiles. Whiskers indicate the minimum and maximum values. Nicotinamide (NAM, 1 mM) and FK866 (0.1 nM) were used as the comparison groups. *P<0.05; **P<0.01; ***P<0.001 (Student’s t-test). Scale bar=200 μm.

