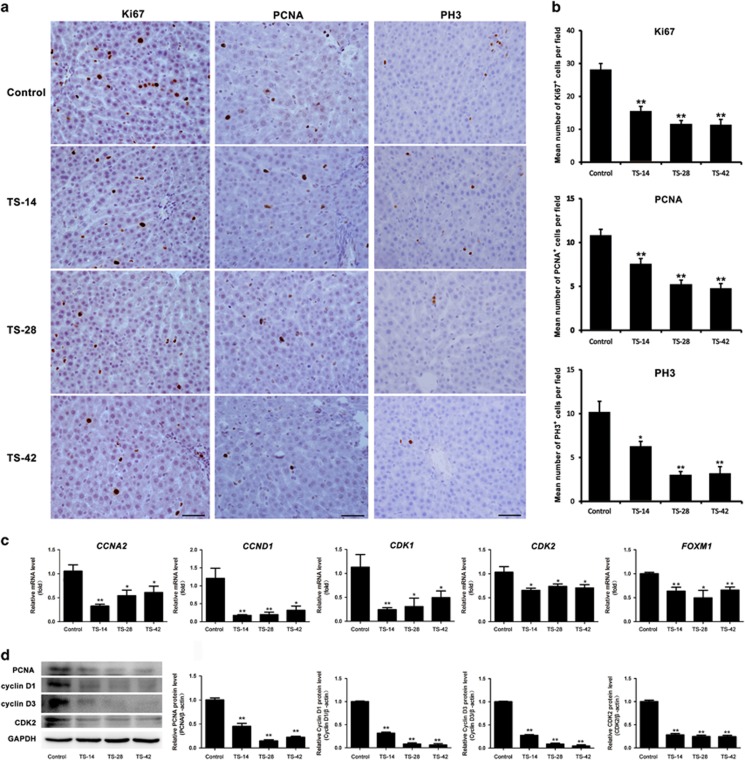
Figure 2.
The effect of SMG on hepatocyte proliferation. (a) Immunostaining analysis of Ki67 (left panels), PCNA (center panels) and PH3 (right panels) in the rat liver of the control, TS-14, TS-28 and TS-42 groups. Scale bar, 50 μm. (b) Quantification of the Ki67-, PCNA- and PH3-positive cell number in the liver of the control, TS-14, TS-28 and TS-42 groups, n=6. (c) RT-qPCR analysis of gene expression related to cell cycle regulation such as CCNA2, CCND1, CDK1, CDK2 and FOXM1 in the rat liver of the control and TS groups. n=6. (d) Protein levels of PCNA, cyclin D1, cyclin D3 and CDK2 were analyzed by western blotting. n=3. The intensity of the protein bands was semi-quantitatively analyzed using ImageJ software. *P<0.05, **P<0.01 compared to Control. SMG, simulated microgravity; TS, tail suspension.

