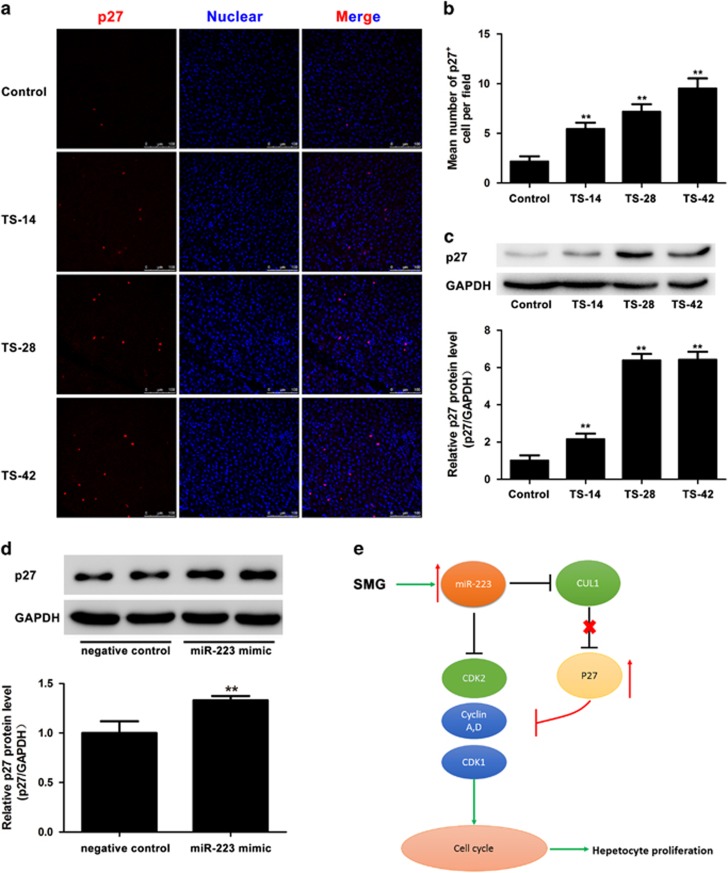
Figure 6.
Upregulation of p27 expression in vitro and in vivo. (a) Immunofluorescence staining of p27 in the rat liver of the control, TS-14, TS-28 and TS-42 groups. Images were captured by a Leica TCS SP5 confocal scanning laser microscope. p27 in red (Cy3); nuclei in blue (DAPI). Scale bar, 50 μm. (b) Quantification of the number of p27-positive cells in the liver of the control, TS-14, TS-28 and TS-42 groups. n=6. (c) p27 protein expression level in the TS liver was significantly elevated compared with that of the control as shown by western blotting and semi-quantitative evaluation using ImageJ software. (d) The expression of the p27 protein in Hepa1-6 cells was examined 48 h after transfection with miR-233 mimic and negative control by western blotting and semi-quantitatively evaluated using ImageJ software. *P<0.05, **P<0.01 compared to Control. (e) Diagram illustrating the regulatory hierarchy among miR-223 and its targets CDK2 and CUL1 in the control of hepatocyte proliferation.

