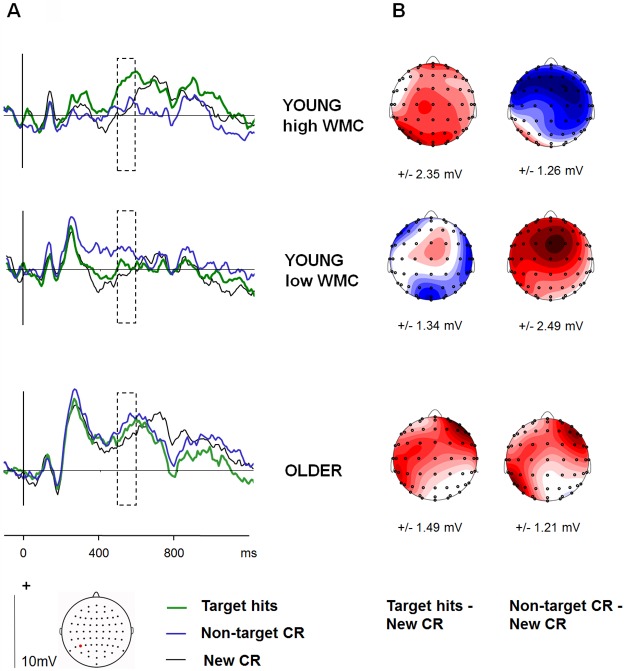
Fig 2. Left parietal old/new effects.
(A) Grand-average waveforms at the P5 electrode site for each age group, showing ERPs to the 3 main conditions. The young group are divided into high-WMC and low-WMC sub-groups, based on a median split (see ERP results). (B) Scalp topographies of between-condition differences in mean ERP amplitude from 500–600 ms. The topographic plots are of old-new subtractions for Target Hits and Non-target CR. Maps are scaled to the maxima (red) of each effect, and their ranges are displayed under each map in microvolts.

