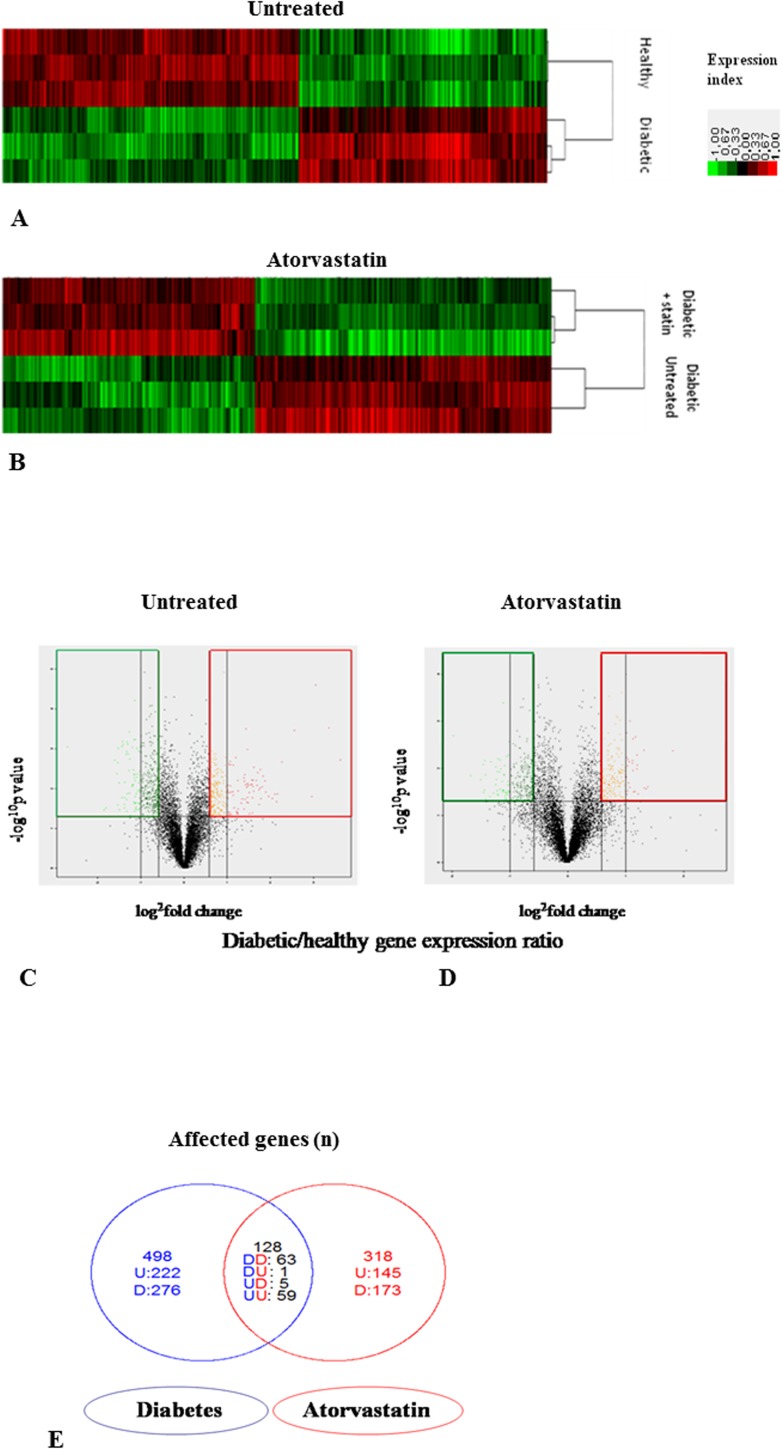
Fig 2. Effects of atorvastatin on the transcriptome of left ventricles of healthy or diabetic rats.
Panel A-B Heat Map of RNA expression profiles in diabetic versus healthy left ventricles (Panel A) or in statin diabetic versus untreated diabetic left ventricles (Panel B); Color scale indicate relative expression ratio for each gene in diabetic versus healthy left ventricle (Panel A) or in statin versus untreated diabetic left ventricle. Panel C-D Volcano Plot for the modification of genes expression by diabetes in heart ventricle (Panel C) and by atorvastatin in diabetic left ventricle (Panel D). The vertical axis represents the p value (-log10 p value) and the horizontal axis range the fold change (log2 ratio) between diabetic and healthy left ventricles (Panel C) or statin diabetic versus untreated diabetic left ventricles (Panel D) (by t-test). Genes in the area delimited in red have a fold change greater than 1.5 with a p value < 0.05. Genes in the area delimited in green have a fold change greater than -1.5 (ratio <0.67) with a p value < 0.05. Panel E Venn diagram representing the differently expressed genes in diabetic versus healthy left ventricles in blue and in statin diabetic versus untreated diabetic left ventricles in red (p<0.05). D is for down-regulation in diabetic versus healthy left ventricles, U for up-regulation. The overlapping part represents the genes modified by diabetes as well as statin, with up- or down-regulation for each comparison.

