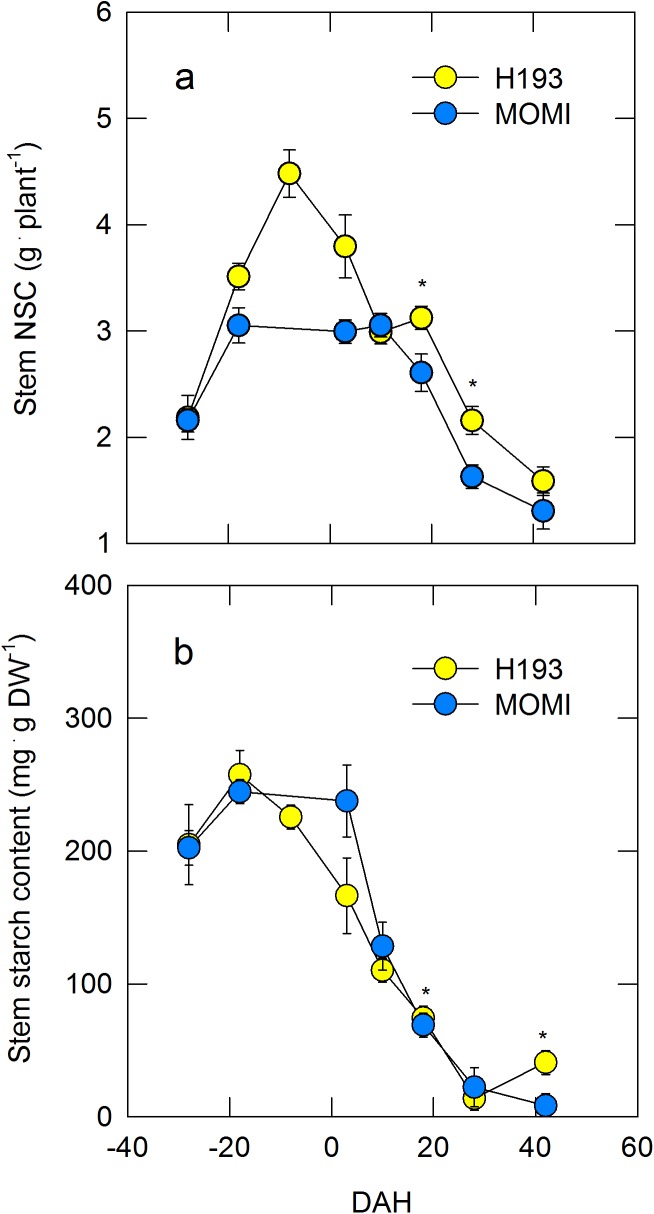
Fig 1.
Time course of changes in nonstructural carbohydrate per plant (a) and starch content (b) in the stems (culms and leaf sheaths) of two high-yielding rice cultivars during development in field-grown plants in 2013. Yellow and light blue circles indicate H193 and MOMI, respectively. Data in a and b are the mean ± SEs of n = 3. Significance at the 0.05 probability levels is indicated with *.

