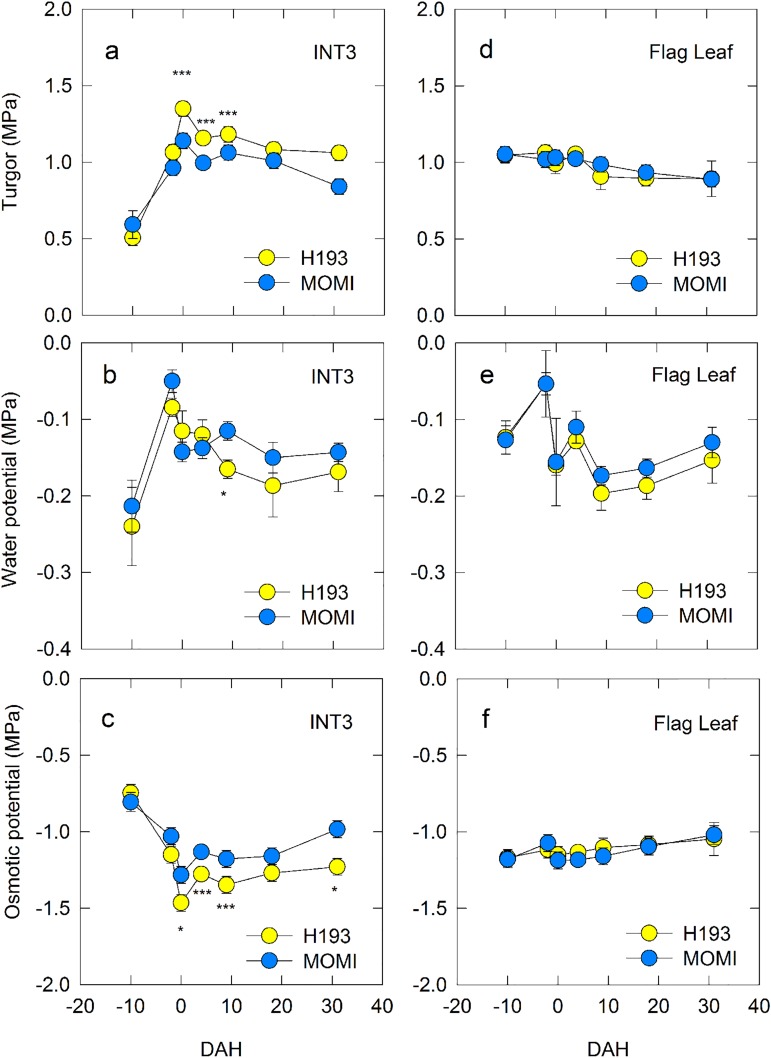
Fig 3.
Changes in turgor pressure (a,d), water potential (b,e), and osmotic potential (c,f) of INT3 (a-c) and flag leaf (d-f) during development. Yellow and light blue circles indicate H193 and MOMI, respectively. Data are mean ± SEs for 3–4 plants from three independently repeated experimental plots in 2014. Significance at the 0.05 and 0.001 probability levels is indicated by * and ***, respectively.

