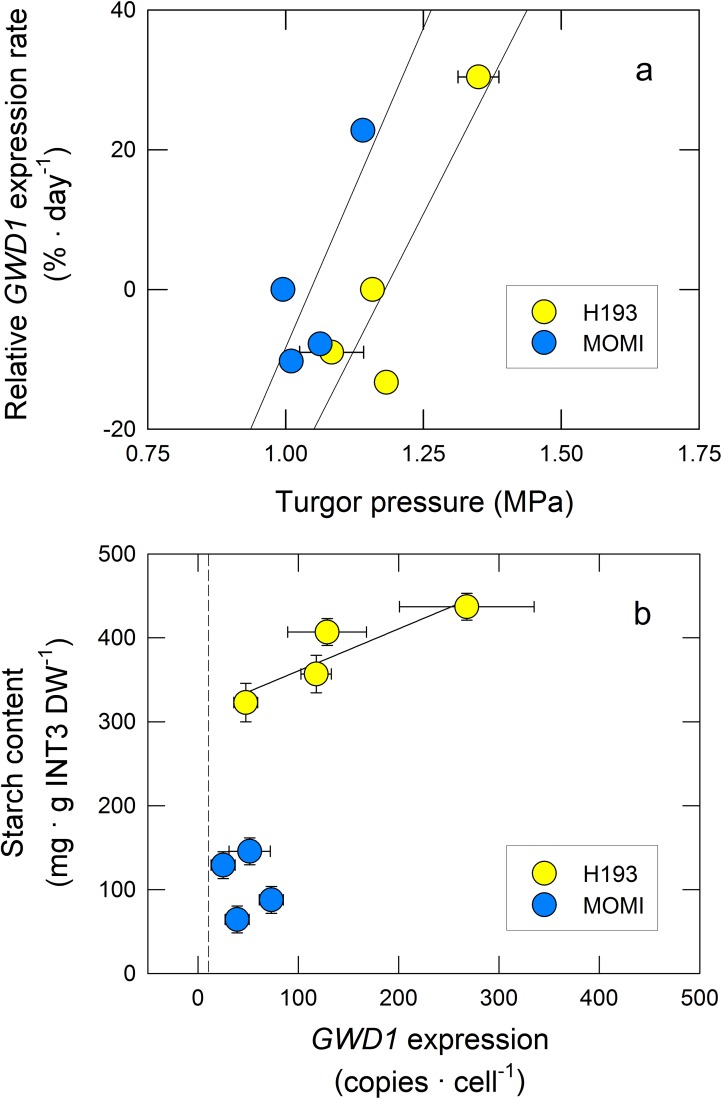
Fig 6.
Relative GWD1 expression rate as a function of turgor pressure in the mature region of INT3 in H193 and MOMI (a). Starch content plotted against GWD1 expression level estimated per cell in H193 and MOMI (b). The solid lines indicate regression lines. Yellow and light blue symbols indicate H193 and MOMI, respectively. The linear regression between turgor pressure (collected between 0 and 18 DAH, see Fig 3A) and relative GWD1 expression rate in H193 and MOMI was y = 155.06x-182.99 (r2 = 0.78) and y = 182.87x-191.17 (r2 = 0.63), respectively. The dashed line in b indicates 10 copies per cell, which corresponds the border of biologically insignificant basal level of expression. The linear regression between starch content and GWD1 expression level per cell in H193 was y = 0.50x +310.66 (r2 = 0.82).

