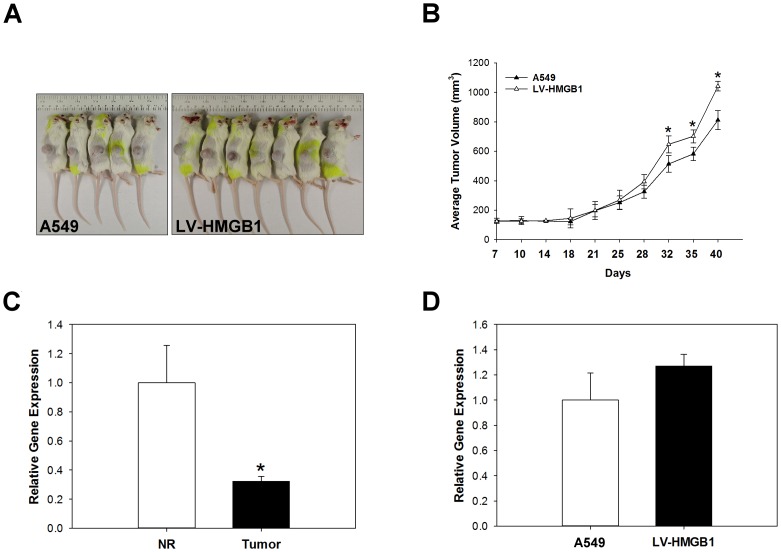
Fig 8. Overexpression of HMGB1 in NSCLC xenografts model.
A549 cells and LV-HMGB1 cells were inoculated into the right flank of severe combined immunodeficiency mice. Tumor volume was measured every 3 days with slide calipers starting from day 7, and a growth curve was plotted (A and B). *p <0.05 as compared to the A549 group. Normal/tumour tissue transfected with or without LV-HMGB1were collected and the expression of miR-200c was measured by real-time PCR (C and D). *p <0.05 as compared to the normal (NR) group.

