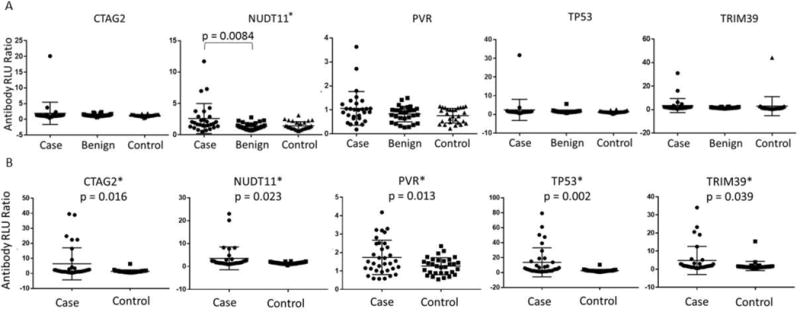
Figure 3.

Autoantibody responses in serous ovarian cancer A. training set and B. validation set. P-value was calculated by a two-tail t test and * indicates statistically significant antigens (p < 0.05). Data is presented as antibody Relative Light Unit (RLU) ratio (Antigen: GST control ratio).
