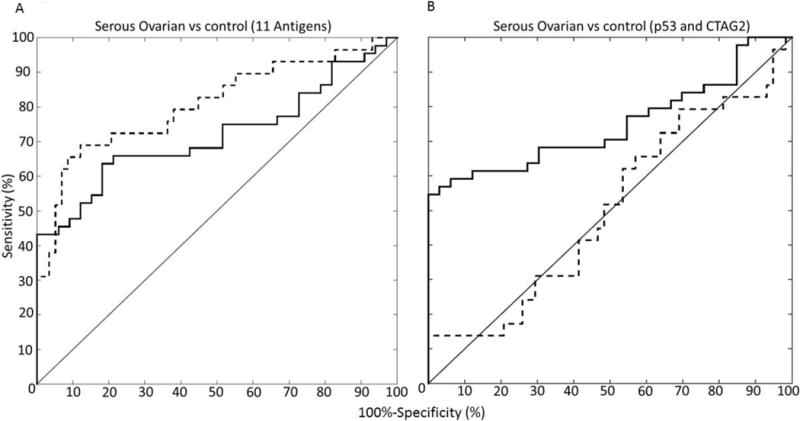
Figure 4.

ROC classifier of the A. 11 TAAb classifier (CTAG2, ICAM3, KSR1, NUDT11, NXF3, POMC, PVR, STYXL1, TP53, TRIM39, and UHMK1) and B. p53 and CTAG2 classifier was calculated using a binary logistic regression analysis. The dotted line indicates the training set, consisting of serous ovarian cases, n = 29 vs benign disease and healthy controls, n = 58) and the solid line indicates the validation set (serous ovarian cases, n = 34 vs healthy controls, n = 32). We used the values obtained from our validation set to report our sensitivity and specificity.
