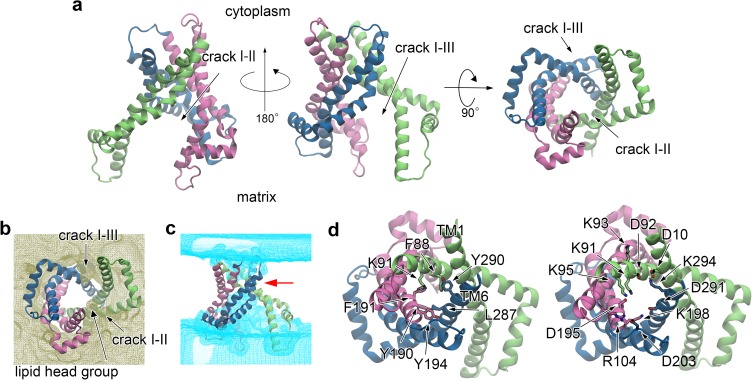
Fig 6. Protein structure in the apo IF form.
Results from APO1 simulation were shown. (a) The average structure calculated from the last 100-ns portion of the trajectory. (b-c) Distributions of lipid molecules (b) and water molecules (c) contoured at 0.3 occupancy level calculated from the last 100-ns portion of the trajectory are shown. A red arrow indicates the cytoplasmic constriction site in the IF form. (d) Hydrophobic residues and charged ones participating in the cytoplasmic inter-domain hydrophobic packing and salt-bridge network in the IF form are shown in views from the cytoplasmic side in left and right panels, respectively.

