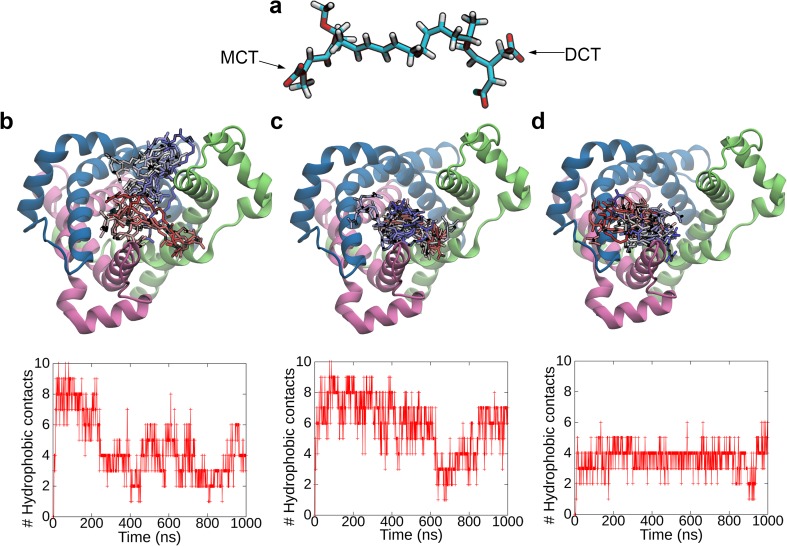
Fig 7. Binding of an inhibitor, BA, to the matrix pore of the apo IF form.
(a) Structure of BA. Mono-carboxyl terminus (MCT) and di-carboxyl one (DCT) at the two ends of a hydrocarbon chain, respectively, are indicated. (b-d) Trajectories of BA in the simulations, BA8 (b), BA16 (c), and BA20 (d). In upper panels, trajectories of BA are mapped to the average structure of the last 100-ns portion of APO3 trajectory. Snapshots of BA at every 10 ns are shown in stick representation. Color is changing from red to white and white to blue along the time course. In lower panels, time courses of hydrophobic contacts are shown. See S1 Text for the definition of the hydrophobic contact.

