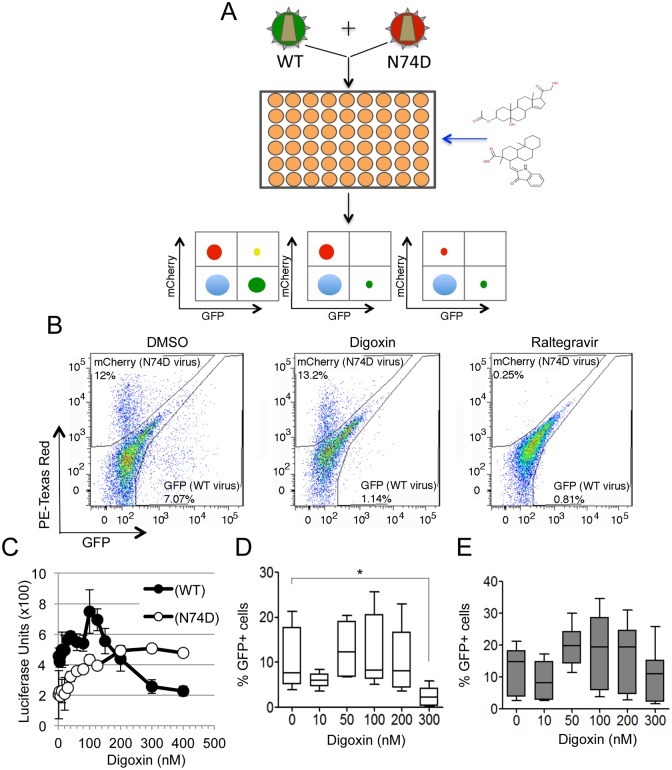
Fig 1. Digoxin inhibits HIV-1 infection more potently than N74D virus.
(A) Schematic depiction of the high through put screen; WT HIV-1 vector expresses GFP and N74D mutant HIV-1 vector expresses mCherry. Jurkat cells are co-infected with both viruses and a library of small compounds is screened in 384 well plates. Cells are analysed by dual-colour flow cytometry. Left plot depicts a non-hit compound, middle plot depicts a selective hit and the right plot depicts a non-selective hit. (B) Jurkat cells were co-infected with WT and N74D vectors at an MOI of 0.1 in the presence of the indicated compounds and analysed 24h later. Representative dot plots from the FACS analysis for control (DMSO only), digoxin (300nM) or raltegravir (100nM) treated cells. (C) 1G5 Jurkat luciferase indicator cells were infected at the same MOI with NL4.3 WT or with NL4.3 N74D in the presence of the indicated concentrations of digoxin. Luminescence was measured 48 hours after infection; data are representative of two experiments performed in triplicate. Error bars represent SEM. (D, E) Memory CD4+ T-cells were stimulated via CD3/CD28 Abs for 3 days and infected with VSV-G pseudotyped HIV-1 LAIΔenv WT (D) or N74D mutant (E), cells were cultured in media containing IL-2 in the presence or absence of the indicated doses of digoxin for additional 40 hours. The percentage of viable, infected (GFP+) cells was determined by flow cytometry. Bar graphs represent mean ± SD of 9 donors. Friedman test p-values are indicated on the graphs: *, p<0.05.

