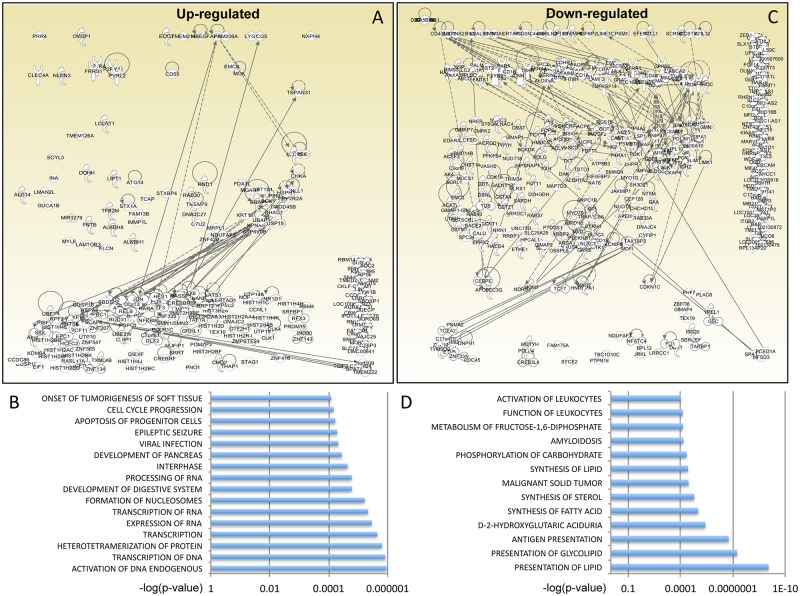
Fig 3. Digoxin perturbs expression of specific gene pathways.
(A) IPA-generated diagram showing the 221 genes up-regulated by digoxin and their networks. Continuous lines indicate direct and experimentally validated interactions between genes; dashed lines indicate experimentally validated, indirect interactions. Circular arrows indicate self-activation. Genes that could not be assigned to a network are shown in the right hand corner. (B) List of the main functionally annotated pathways identified by IPA on the basis of the 221 genes up-regulated by digoxin. The p-value for each pathway is shown on the x-axis. The full dataset is available in S3 File. (C) IPA-generated diagram showing the 336 genes down-regulated by digoxin, same as for panel (A). (D) List of the main functionally annotated pathways identified by IPA on the basis of the 336 genes down-regulated by digoxin. The p-value for each pathway is shown on the x-axis. The full dataset is available in S4 File.

