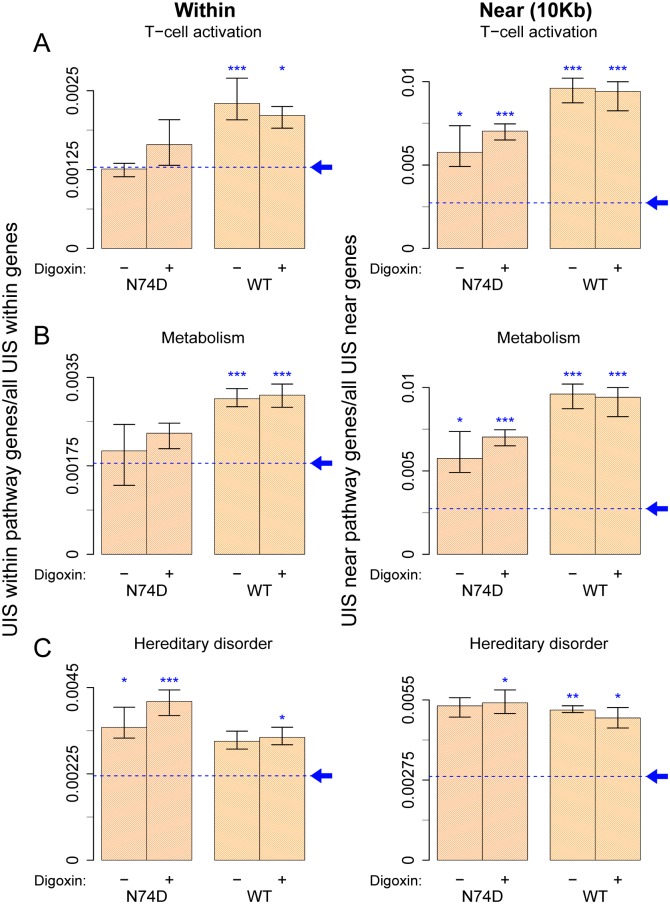
Fig 5. WT HIV-1 integrates more frequently than N74D within or near genes involved in T-cell activation and cell metabolism.
UIS, as well as matched random controls, were obtained as described in Fig 4 and annotated for integration within or near (within 10kb of transcript start site of) known genes, as well as genes susceptible to down-regulation by digoxin belonging to specific IPA pathways: T-cell activation, cell metabolism and hereditary disorder. Plots for integration of WT and N74D virus within (left panel) or near (right panel) T-cell activation genes (A), cell metabolism genes (B) and hereditary disorder genes (C). Each bar denotes the proportion of integration sites found within (left panel) or near (right panel) genes of the particular pathway within all integration sites within or near genes. The same analysis was carried out in the matched random control sites, shown as the blue dashed baseline, pointed by an arrow. Each bar shows an aggregate result from all three replicates, with the range of results for the individual replicates shown by the whiskers. Statistical significance refers to UIS in sample relative to the baseline bias and was assessed using the Fisher’s exact test with Bonferroni’s correction for multiple comparisons (* < 0.05, ** < 0.01, *** < 0.001). No significant difference was found between control (DMSO) and digoxin-treated samples in these groups.

