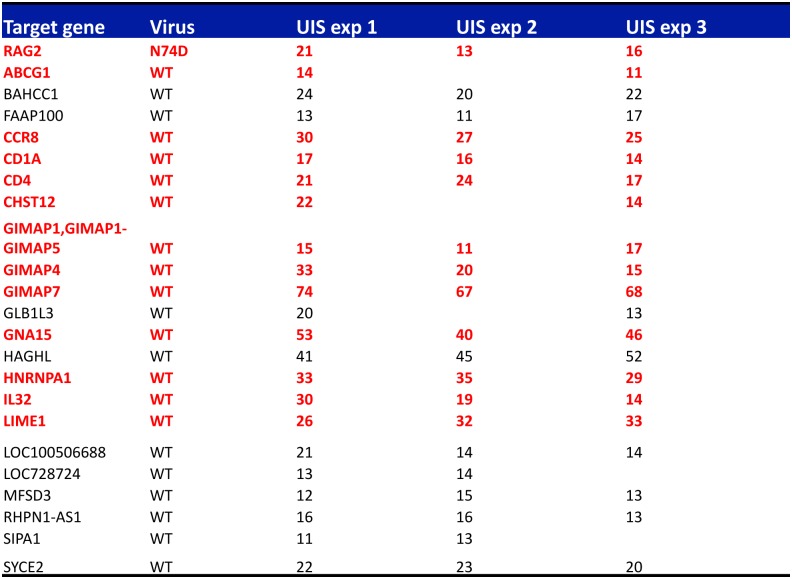
Fig 6. Analysis of integration frequencies shows enrichment of integration hotspots within genes involved in T-cell activation and cell metabolism.
Global integration frequencies were calculated in each replicate experiment. An integration hotspot had > 5 independent integration events in at least two replicate experiments. Genes highlighted in red are involved in T-cell activation or cell metabolism as determined by IPA and Genecards annotation.

