Figure 4.
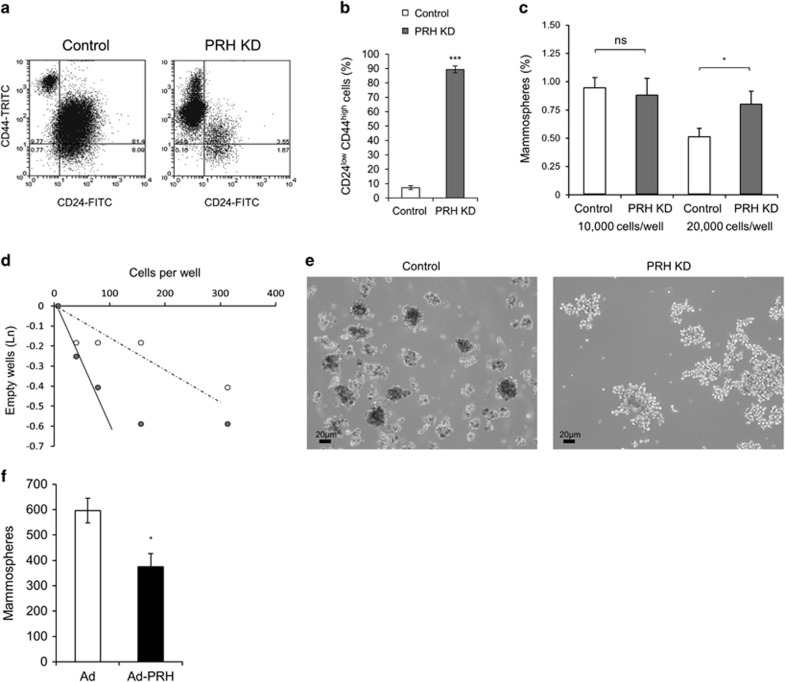
PRH levels influence mammosphere formation. MCF-7 control and PRH KD cell lines were induced with IPTG for 7 days then analysed by flow cytometry. (a) Flow cytometry analysis of the CSC markers CD24 and CD44. (b) Quantification of CD24loCD44hi cells (n=4, Student’s t-test, ***P<0.005). (c) Quantification of primary mammospheres formed by control and PRH KD MCF-7 cells (n=3, Student’s t-test, *P<0.05). (d) Limiting dilution analysis with secondary MCF-7 control and PRH KD mammospheres counted at day 14, (n=5). (e) Mammospheres and mammosphere-like particles were imaged under optical light (mag. × 10). (f) Quantification of primary mammospheres formed by control and PRH overexpressing MCF-7 cells (n=3, Student’s t-test, *P<0.05).

