Figure 1.
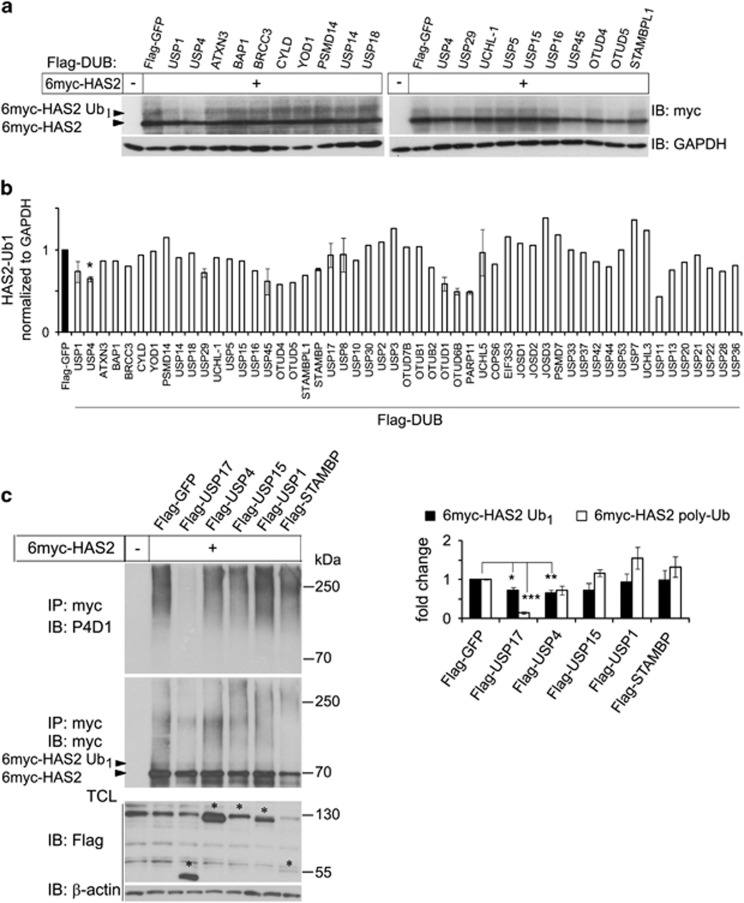
Identification of USP4 and USP17 as de-ubiquitinases of HAS2 by a DUB cDNA expression screen. (a) HEK293T cells (0.3 × 10⁶ cells per well in six-well plates) were co-transfected with 6myc-tagged HAS2 cDNA and individual Flag- and HA-tagged DUB cDNAs. 6myc-tagged empty vector and Flag-tagged vector encoding GFP were used as controls and to equalize the DNA load. Cell lysates were subjected to SDS–PAGE followed by immunoblotting with antibodies against myc as described in Materials and methods, to detect immunoreactive myc-tagged monoubiquitinated HAS2 (HAS2-Ub1; seen as a band of 5–10 kDa higher molecular mass than the 6myc-HAS2 band). (b) Quantification of HAS2-Ub1 of the immunoblots, using ImageJ. Asterisk indicates P<0.05 calculated with Student’s t-test (n=5), and error bars are the average of two experiments. (c) Re-screening of a subset of the DUBs described in a to determine the effects on polyubiquitination of HAS2; denaturated cell lysates were after dilution subjected to immunoprecipitation using a myc antibody followed by immunoblotting using the P4D1 antibody to detect polyubiquitinated HAS2. The right panel shows quantification of mono- as well as polyubiquitinated HAS2 after coexpression of different DUBs. Average±s.e.m. of three independent experiments is depicted. *P<0.05, **P<0.01 and ***P<0.0001, calculated with Student’s t-test.

