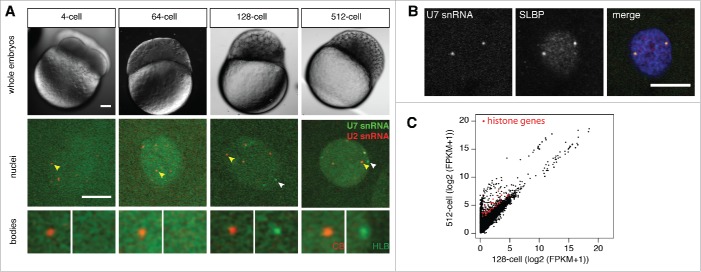
Figure 2.
HLB assembly coincides with the onset of zygotic transcription. (A) Embryonic nuclei imaged at the indicated stages after injection of fluorescent U2 snRNA (red) to mark CBs and U7 snRNA (green) to mark HLBs. Upper panel: DIC image from in vivo imaging of whole zebrafish embryos with 10x magnification. Scale bar equals 100μm. Middle panel: Single confocal sections of in vivo imaging of zebrafish embryos labeled with microinjected U7 and U2 snRNA. Scale bar equals 10μm. Arrowheads point to the nuclear body shown 2x magnified in bottom panel. A Gaussian blur filter was applied for display reasons. (B) Immunostaining for SLBP (red in the merged panel) shows the concentration of SLBP in the same foci as those marked by injected U7 snRNA (green). Scale bar equals 10 μm (C) Scatterplot showing the levels in FPKM of individual transcripts metabolically labeled by 4s-UTP injection into 1-cell embryos and purified from 128-cell (x-axis) and 512-cell (y-axis) embryos; histone genes with a fold change in transcript level of log2 ≥ 2 are displayed in red, showing that transcription of histone genes begins between the 128-cell and 512-cell stage. Data taken from ref. 27.

