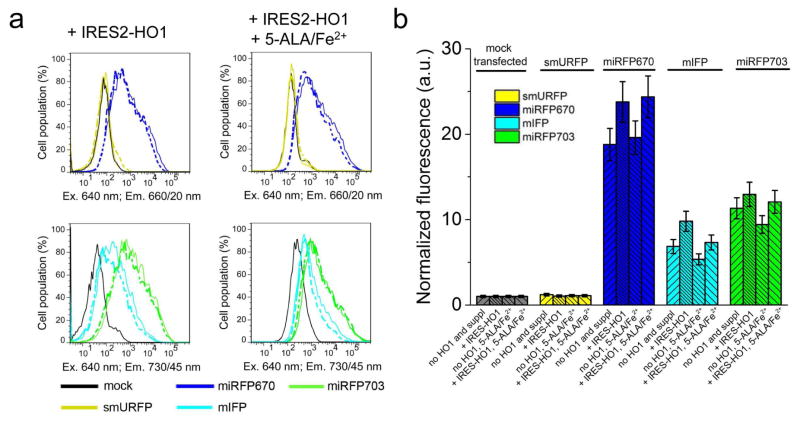
Figure 3. Effective brightness of NIR FPs in presence of HO1 and 5-ALA with FeSO4.
(a) Fluorescence intensity distribution of live HeLa cells transfected with smURFP, miRFP670, mIFP and miRFP703 co-expressed with HO1 downstream of IRES2 element (in EGFP-T2A-NIRFP-IRES2-HO1 constructs) with or without 250 μM 5-ALA and 40 μM FeSO4 was analyzed using flow cytometry. The supplements were added for 24 h period. Fluorescence distribution of cells co-expressing NIR FPs with catalytically inactive HO1 (H25A/D140F) mutant as a control is shown with dashed lines. (b) Quantification of the data presented in (a). Mean NIR fluorescence intensity was normalized to mean green fluorescence intensity of EGFP co-expressed via T2A peptide upstream of NIR FPs (to account for transfection efficiency) and to mean fluorescence intensity of mock transfected cells in the 660/20 nm channel (for miRFP670 and smURFP) or in the 730/45 nm channel (for miRFP703 and mIFP) (to account for cellular autofluorescence). Error bars, s.e.m. (n = 3; transfection experiments). See also Figure S2 and Table 2.

