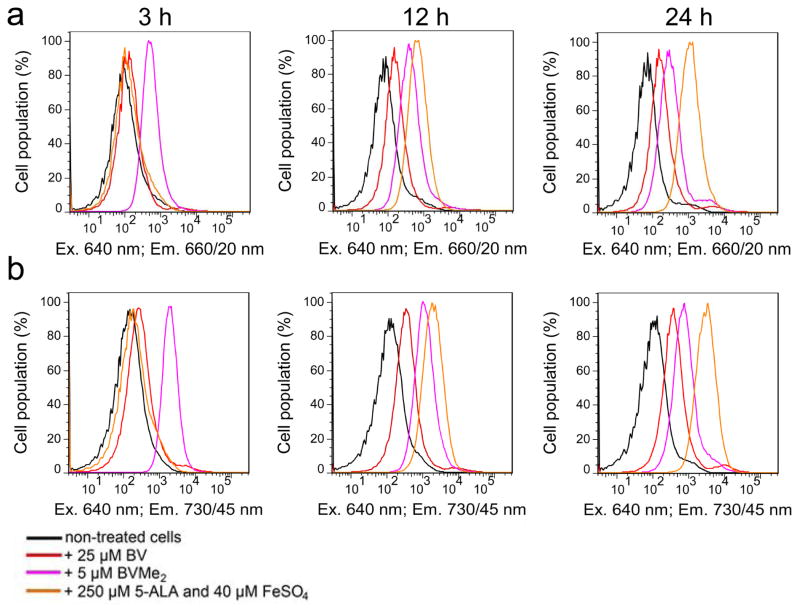
Figure 4. Autofluorescence of mammalian cells with exogenous chromophores or heme precursor.
Fluorescence intensity distribution of live HeLa cells transfected with a mock plasmid in (a) the 660/20 nm channel and (b) the 730/45 nm channel without (black line) or with 25 μM BV (red line), 5 μM BVMe2 (magenta line), or 250 μM 5-ALA and 40 μM FeSO4 (orange line) was analyzed using flow cytometry 3, 12 and 24 h after the supplementation.

