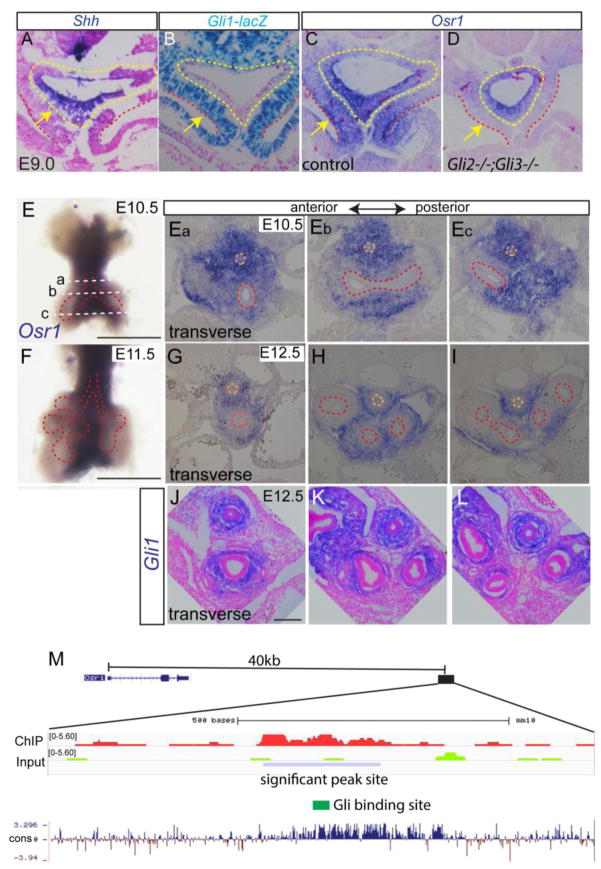
Fig. 1.
Osr1 is a Gli2,3 target and displays dynamic expression pattern during foregut development. (A) Shh in situ staining on E9.0 transverse foregut section. Arrow points to foregut epithelial. (B) LacZ staining in foregut using Gli1lacZ reporter mouse. (C–D) Osr1 in situ on transverse sections of E9.0 foregut in control and Gli2−/−;Gli3−/− double mutant. Yellow dotted lines mark endoderm while the region in between yellow and red dotted lines denotes the splanchnic mesoderm. Arrows point to splanchnic mesenchyme. (E) Whole mount in situ of Osr1 in dissected E10.5 foregut. Scale bar: 500 μm. Dotted lines corresponds to the section levels in Fig. Ea–Ec. (Ea–Ec) Osr1 in situ on transverse sections of foregut region at E10.5 from anterior to posterior. (F) Whole mount Osr1 in situ in E11.5 dissected respiratory tissue. Scale bar: 500 μm. (G–I) Osr1 in situ on transverse sections of foregut at E12.5 from anterior to posterior region. Orange dotted line marks esophagus and red dotted line marks respiratory epithelial cells. (J) Gli1 in situ on transverse sections through trachea and main bronchi. Scale bar: 100 μm. (M) Browser shot of previously published ChIP-seq data in second heart field tissue comparing Gli3-flag ChIP to input around Osr1 region together with mammal pairwise conservation. Blue box indicates the significant Gli3-flag ChIP signal located 40kb downstream of Osr1 transcription start site.

