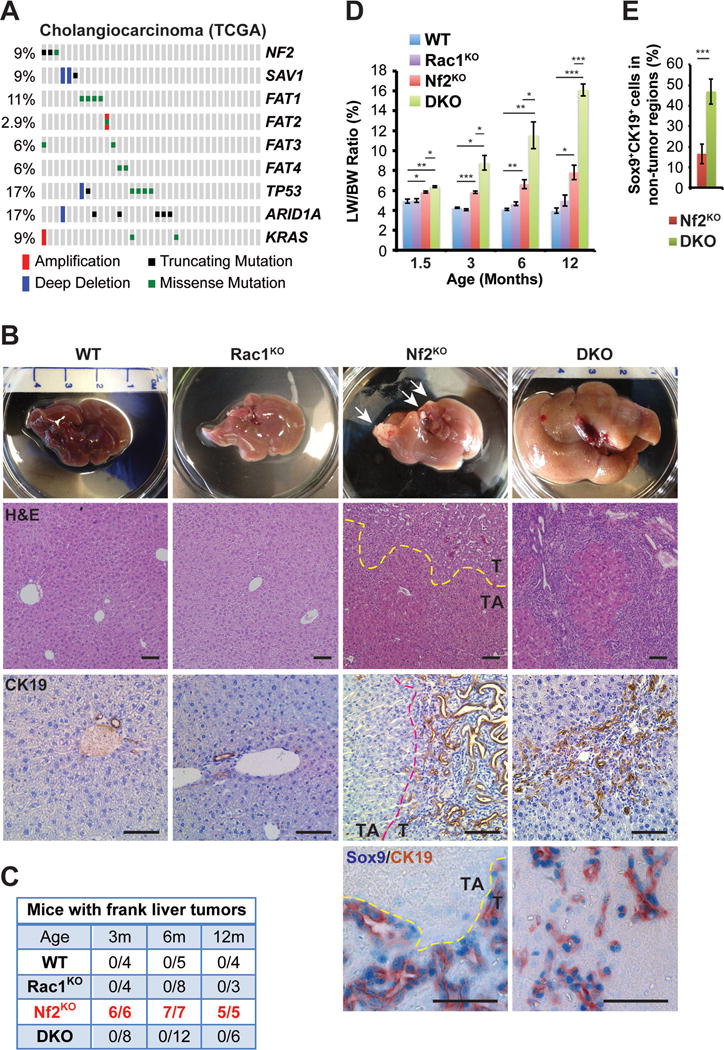
Figure 1. Co-deletion of Rac1 suppresses tumorigenesis but exacerbates hepatomegaly induced by Nf2 ablation.

(A) Mutation and copy number status of indicated genes in TCGA cholangiocarcinoma collection (N=35).
(B) Representative images of gross livers, H&E staining, and CK19 immunohistochemistry (IHC) of livers from 6-month-old WT, Rac1KO, Nf2KO and DKO mice, and Sox9 (blue)/CK19 (brown) double IHC of livers from 3-month-old Nf2KO and DKO mice. Arrows indicate frank tumor lesions. Dotted lines mark the borders between tumor (T) and tumor adjacent (TA) areas in the Nf2KO livers. Scale bars = 100 μm.
(C) The numbers of WT, Rac1KO, Nf2KO, and DKO mice with frank liver tumors at 3, 6 and 12 months of age. The tumor numbers in Nf2KO mice are highlighted in red.
(D) Liver weight to body weight ratios (LW/BW) of 1.5-, 3-, 6- and 12-month-old WT, Rac1KO, Nf2KO and DKO mice (1.5 months: WT n=8, Rac1KO n=4, Nf2KO n=4, DKO n=6; 3 months: WT n=4, Rac1KO n=4, Nf2KO=6, DKO n=8; 6 months: WT n=5, Rac1KO n=8, Nf2KO=7, DKO n=12; 12 months: WT n=4, Rac1KO n=3, Nf2KO=5, DKO n=6). Data are represented as mean +/− SEM. *P<0.05, **P<0.005, ***P<0.0005.
(E) Average percentage of Sox9+CK19+ cells in 3-month-old Nf2KO_TA regions (n=4) and DKO (n=6) livers. Data are represented as mean +/− SD. ***P<0.0005.
See also Figure S1.
