. 2017 Jun 6;6:e24133. doi: 10.7554/eLife.24133

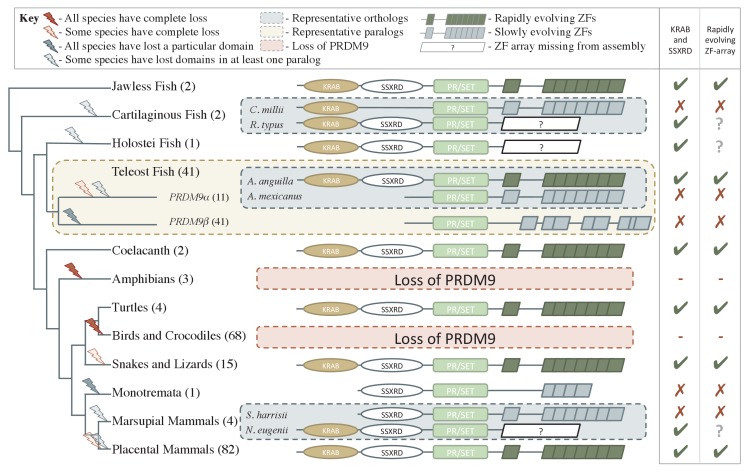
Figure 1. Phylogenetic distribution and evolution of PRDM9 orthologs in vertebrates.

Shown are the four domains: KRAB domain (in tan), SSXRD (in white), PR/SET (in light green) and ZF (in gray/dark green; the approximate structure of identified ZFs is also shown). The number of unique species included from each taxon is shown in parenthesis. Complete losses are indicated on the phylogeny by red lightning bolts and partial losses by gray lightning bolts. Lightning bolts are shaded dark when all species in the indicated lineage have experienced the entire loss or same partial loss. Lightning bolts are shaded light when it is only true of a subset of species in the taxon. ZF arrays in dark green denote those taxa in which the ZF shows evidence of rapid evolution. White rectangles indicate cases where we could not determine whether the ZF was present, because of the genome assembly quality. For select taxa, we present the most complete PRDM9 gene found in two examplar species. Within teleost fish, we additionally show a PRDM9 paralog that likely arose before the common ancestor of this taxon; in this case, the number of species observed to have each paralog is in paranthesis. Although the monotremata ZF is shaded gray, it was not included in our analysis of rapid evolution because of its small number of ZFs.

DOI: http://dx.doi.org/10.7554/eLife.24133.003

Figure 1.

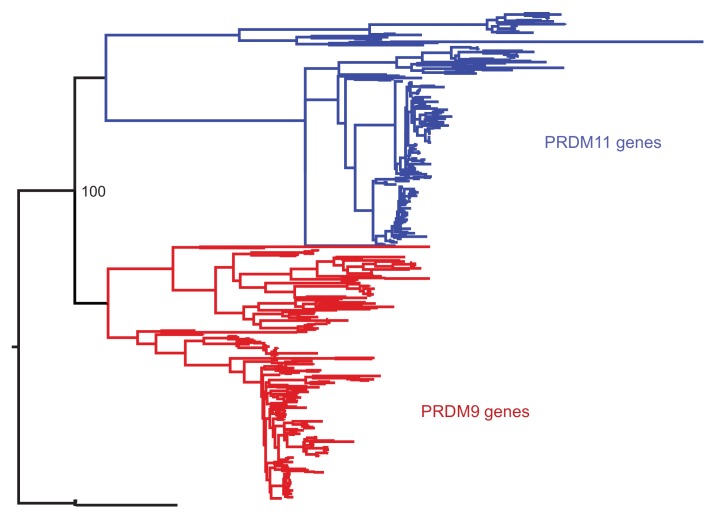
Figure 1—figure supplement 1. Phylogenetic approach to identifying PRDM9 orthologs and related gene families.

Figure 1—figure supplement 1.

A maximum likelihood phylogeny built with RAxML, using an alignment of SET domains, distinguishes between genes that cluster with mammalian PRDM9 and PRDM11 with 100% bootstrap support. Genes shown in black, which are orthologous to both PRDM9 and PRDM11, are only found in jawless fish.

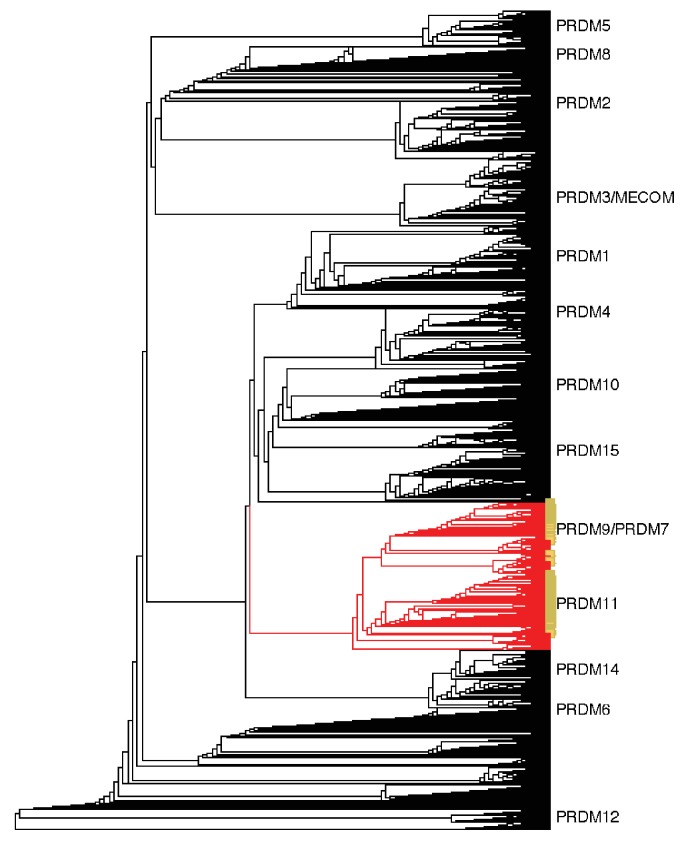
Figure 1—figure supplement 2. Neighbor-joining (NJ) guide tree based on the SET domain.

Figure 1—figure supplement 2.

A NJ guide tree analysis on SET domains identified in our RefSeq, whole genome assembly, and transcriptome datasets was used as an initial step to identify sequences clustering with human PRDM9/7 or PRDM11. These sequences (in red) were selected for phylogenetic analysis with RAxML; they included all RefSeq genes in our dataset that have been previously annotated as PRDM9/7 or PRDM11 (in yellow). Genes more closely related to known PRDM genes other than PRDM9 or PRDM11 (in black) were excluded from further analysis.

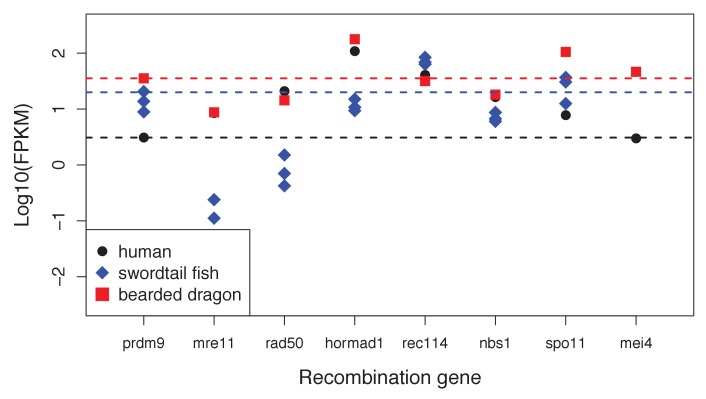
Figure 1—figure supplement 3. Expression levels of genes with a known role in meiotic recombination in testes of three exemplar species: human, swordtail fish and bearded dragon (a lizard).

Figure 1—figure supplement 3.

For three swordtails (X. malinche) and one bearded dragon, the FPKM per individual is plotted for each transcript. For humans, the point represents the average expression of 122 individuals from the gene expression atlas (see Materials and methods). For bearded dragons, PRDM9 and RAD50 were represented by multiple transcripts (two and three respectively), and the average expression level is shown. Dashed lines show the point estimate or average expression level of PRDM9 to highlight that several genes in each species have expression levels comparable to or lower than PRDM9 in testes.

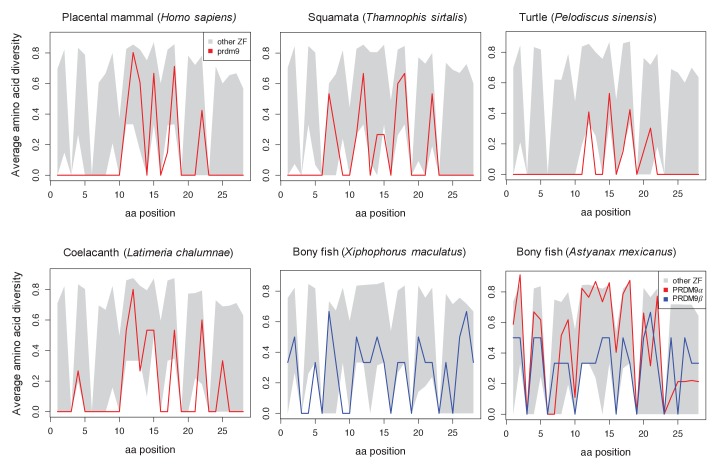
Figure 1—figure supplement 4. Amino acid diversity as a function of amino acid position in the ZF alignment for six examplar species.

Figure 1—figure supplement 4.

Each plot shows the 95% range of diversity levels at that site for all C2H2 ZFs from a species of that taxon (gray); the values at PRDM9 are show in red or blue. Turtles, snakes and coelacanth show a pattern of diversity that is similar to those in mammalian species with a complete PRDM9 ortholog, with higher diversity at DNA-binding sites (residues 11, 12, 15 and 18) and reduced diversity at most other sites. In bony fish, this pattern is not observed in PRDM9β genes (blue) or in partial PRDM9α genes (shown for A. mexicanus), where PRDM9 ZF diversity is more typical of other C2H2 ZFs.

Figure 1—figure supplement 5. Examples of differences in computationally predicted PRDM9 binding motifs for species from three taxa.

Figure 1—figure supplement 5.

Shown are two mouse from the same species (Mus musculus subspecies; Genbank: AB844114.1; FJ899852.1), two pythons from the same species (Python bivittatus; the genome sequence and a Sanger resequenced individual; see Materials and methods), and two species of swordtail fish (X. birchmanni and X. malinche; genome sequences). The position weight matrix was obtained using C2H2 prediction tools available at http://zf.princeton.edu.