. 2017 Jun 6;6:e24133. doi: 10.7554/eLife.24133

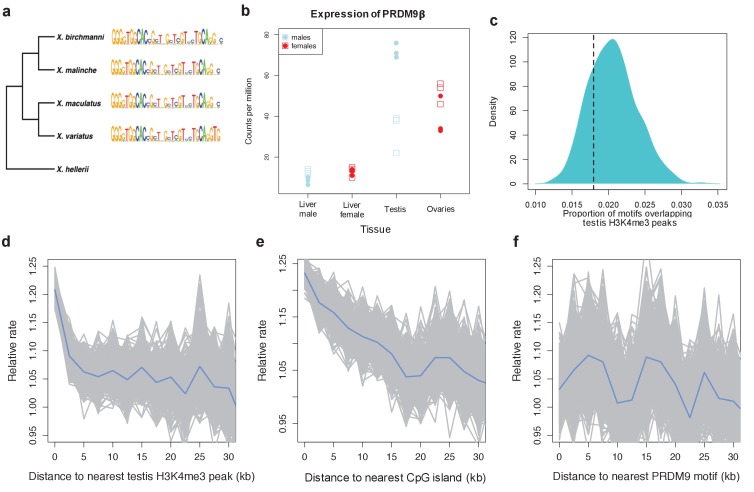
Figure 4. Patterns of recombination and PRDM9 evolution in swordtail fish.

(a) The ZF array of PRDM9 appears to be evolving slowly in Xiphophorus, with few changes over 1 million years of divergence (Cui et al., 2013; Jones et al., 2013). (b) PRDM9 is upregulated in the germline relative to the liver in X. birchmanni (circles) and X. malinche (squares; panel shows three biological replicates for each species). (c) The computationally-predicted PRDM9 binding sites is not unusually associated with H3K4me3 peaks in testes (d) Crossover rates increase near H3K4me3 peaks in testis (e) Crossover rates increase near CGIs (f) Crossover rates do not increase near computationally-predicted PRDM9 binding sites (see Figure 4—figure supplement 3 for comparison). Crossover rates were estimated from ancestry switchpoints in naturally occurring hybrids between X. birchmanni and X. malinche (see Materials and methods).

DOI: http://dx.doi.org/10.7554/eLife.24133.014

Figure 4.

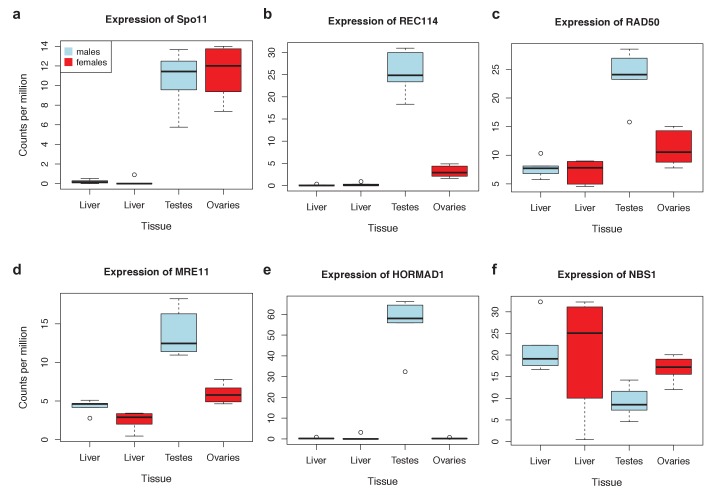
Figure 4—figure supplement 1. Expression levels of meiosis-related genes in swordtail fish tissues.

Figure 4—figure supplement 1.

In general, the seven meiosis-related genes surveyed had higher expression in tissues containing germline cells than liver tissue, but this pattern was much more pronounced in testis tissue (compared to ovary tissue). As a result, we focused our analysis of meiosis related genes on RNAseq data generated from testis. Results shown are based on analysis of three male and female biological replicates from each swordtail species (X. birchmanni and X. malinche).
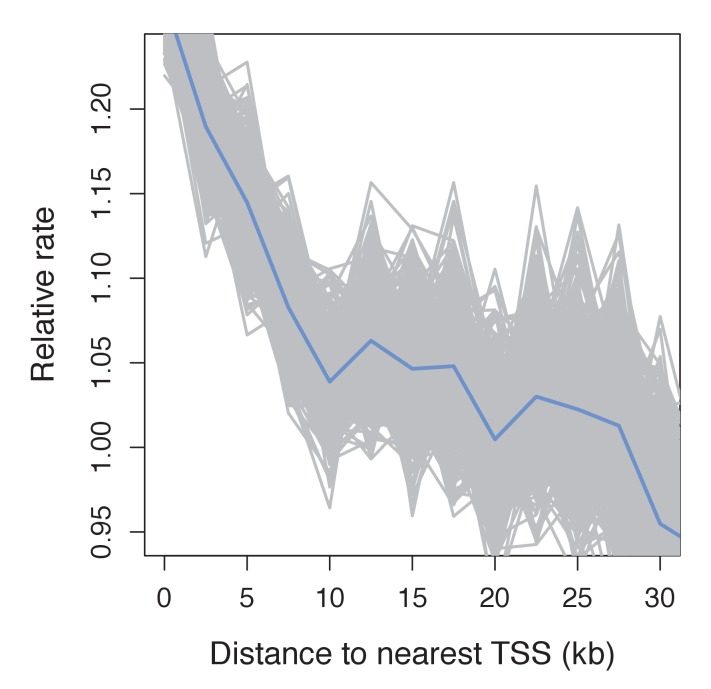
Figure 4—figure supplement 2. Recombination frequency in swordtails as a function of distance to the TSS.

Figure 4—figure supplement 2.

Partial correlation analyses suggest that the association between the TSS and recombination rate in swordtails is explained by H3K4me3 peaks and CGIs.
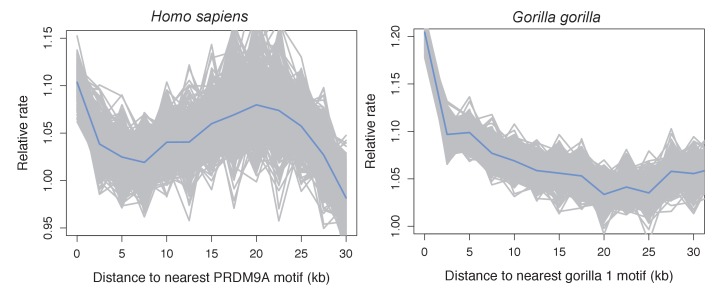
Figure 4—figure supplement 3. Recombination rates show a peak near the computationally predicted PRDM9A binding motif in humans and gor-1 allele in gorillas.

Figure 4—figure supplement 3.

Most work investigating relationships between PRDM9 motifs and recombination rates have focused on the PRDM9 motif empirically inferred from recombination hotspots, but the empirical motif is unknown for many species. To generate results comparable to those we present for swordtails in Figure 4F, we therefore determined recombination rate (using the map based on LD patterns in the CEU; Frazer et al., 2007) as a function of distance to computationally predicted binding sites for the PRDM9A motif in humans and as a function of distance to computationally predicted binding sites for the gor-1 PRDM9 allele (Schwartz et al., 2014) in gorillas (using the LD-based map from Great Ape Genome Project et al., 2016).
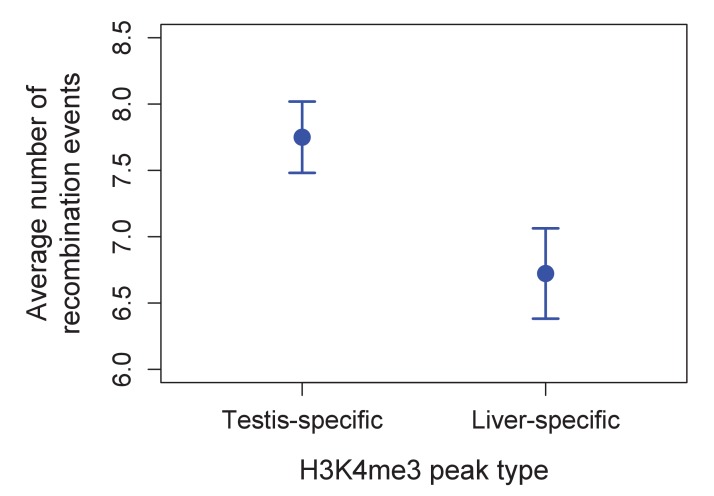
Figure 4—figure supplement 4. Higher observed recombination rate at testis-specific H3K4me3 peaks than liver-specific H3K4me3 peaks.

Figure 4—figure supplement 4.

H3K4me3 peaks found only in the testis and not in the liver of X. birchmanni have higher observed recombination rates in X. birchmanni – X. malinche hybrids. This pattern supports the conclusion that H3K4me3 peaks are associated with recombination in swordtails.
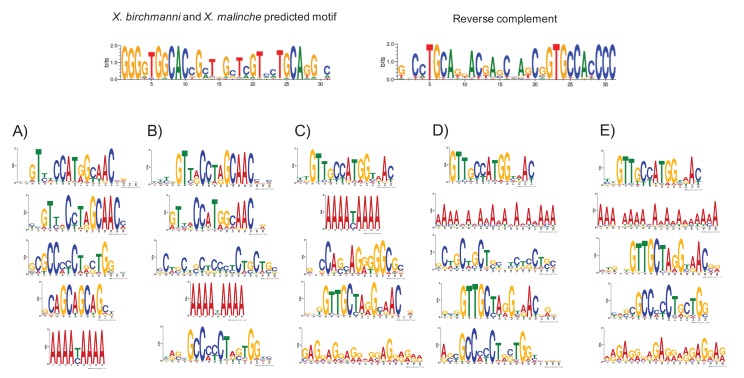
Figure 4—figure supplement 5. MEME prediction of sequences enriched in testis-H3K4me3 peaks relative to liver-specific H3K4me3 peaks.

Figure 4—figure supplement 5.

Results shown in A-E are from five replicate runs of 2000 testis-specific sequences using liver-specific sequences as a background comparison set. The swordtail computationally-predicted PRDM9 binding motif is shown for comparison.