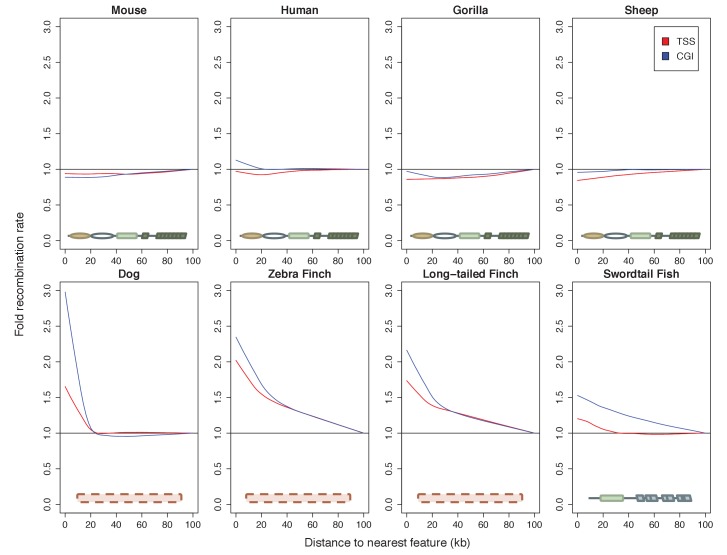
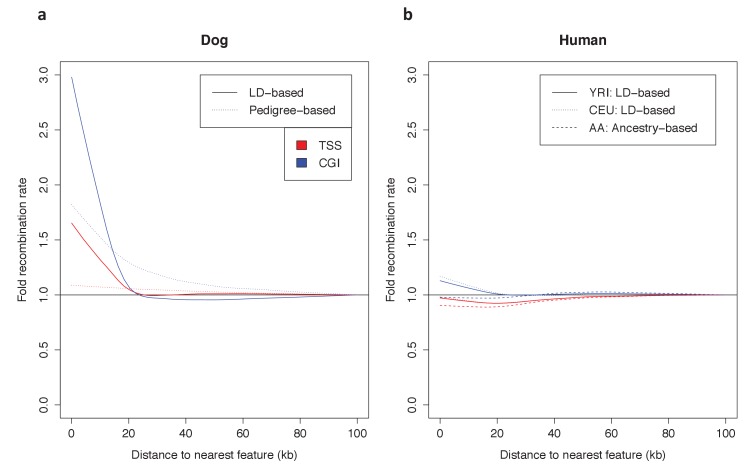
Figure 5. Patterns of recombination near TSSs and CGIs in species with and without complete PRDM9 orthologs.
For each species, recombination rates were binned in 10 kb windows along the genome; curves were fit using gaussian loess smoothing. The fold change in recombination rates shown on the y-axis is relative to recombination rates at the last point shown. Species shown in the top row have complete PRDM9 orthologs (mouse, human, gorilla and sheep), whereas species in the bottom row have no PRDM9 ortholog (dog, zebra finch, long-tailed finch), or a partial PRDM9 ortholog (swordtail fish).


