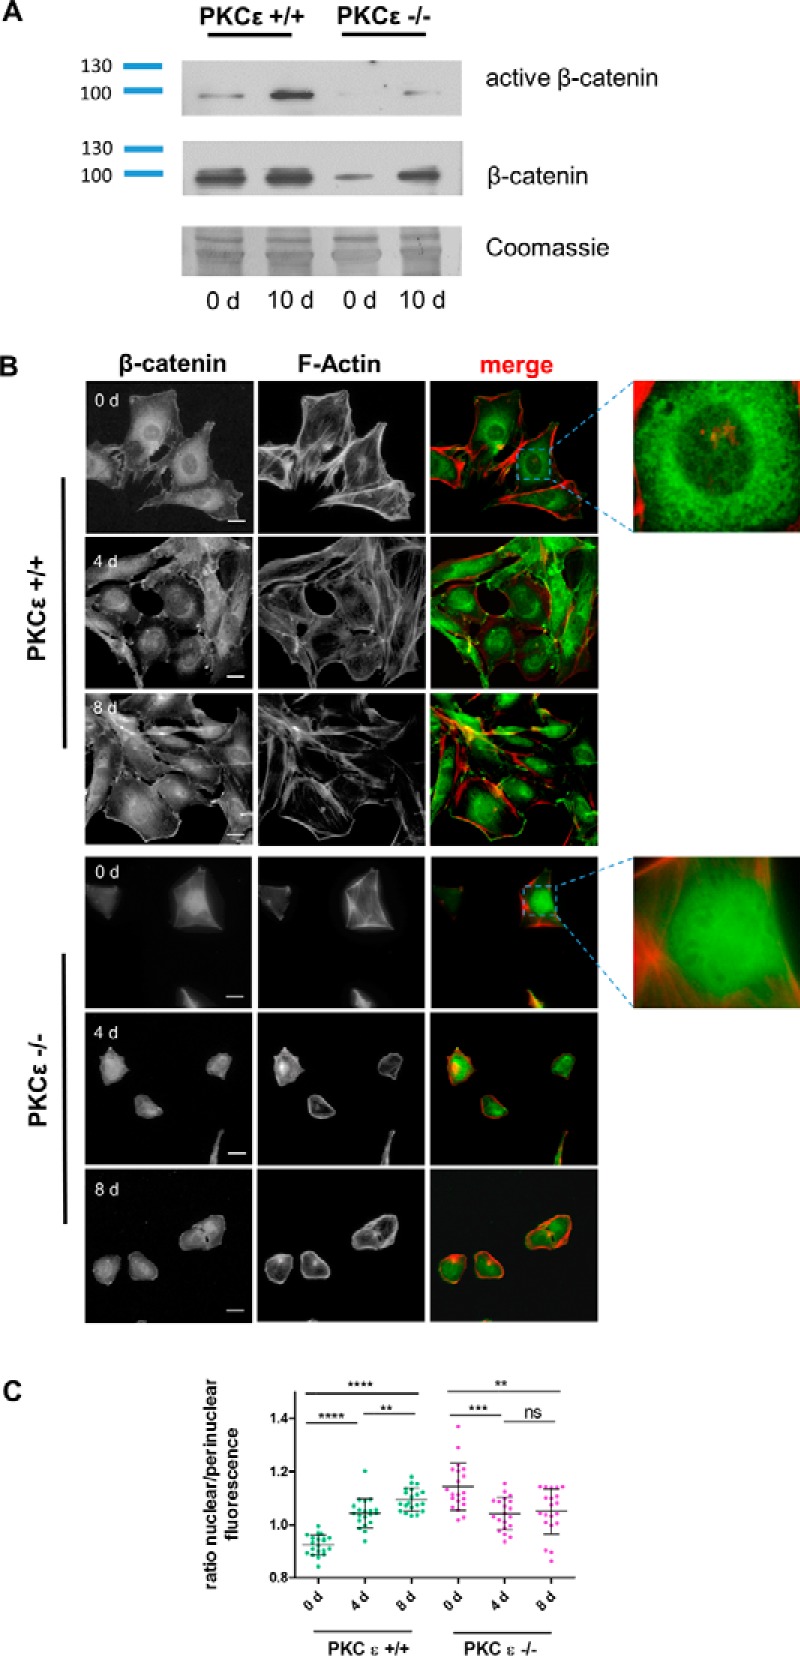
Figure 2.

PKCϵ influences subcellular β-catenin expression and activity. A, Western blot analysis of active β-catenin expression in murine podocytes from day (d) 0 and day 10. B, immunofluorescent staining of PKCϵ+/+ and PKCϵ−/− podocytes at different time points of differentiation (days 0, 4, and 8) shows the subcellular localization of β-catenin (green). Phalloidin staining labels the actin cytoskeleton (red). Scale bars = 40 μm. C, the ratio of nuclear to perinuclear β-catenin was determined by measuring the mean fluorescence intensity with ImageJ. The graph shows the ratio of nuclear to perinuclear β-catenin fluorescence intensity, displaying the reversed shift of subcellular localization of β-catenin during the differentiation (*, p < 0.05; **, p < 0.05; ***, p < 0.0001; ns, not significant; Student's t test). Data are represented as mean ± S.D. of at least three different independent experiments.
