Figure 7.
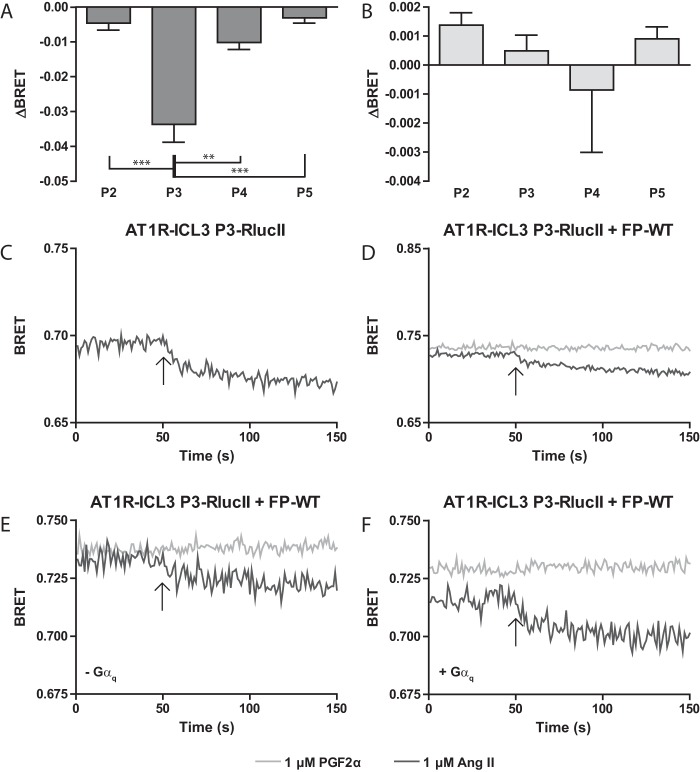
Conformational communication between protomers of the FP/AT1R heterodimer is asymmetric. HEK 293 cells were transfected with AT1R conformation sensors with a FlAsH tag inserted at the indicated position along with FP-WT. Cells were stimulated with 1 μm PGF2α (A) or Ang II (B) and the change in BRET (ΔBRET) due to ligand stimulation is reported. Bars represent the mean of 3 independent biological replicates and error bars represent S.E. Tukey's test was performed where, ** = p < 0.01 and ** = p < 0.001. C and D, kinetic traces of AT1R conformational biosensors responding to ligand. HEK 293 cells were transfected with AT1R-ICL3 P3-RLucII alone (C) or co-transfected with FP-WT (D). The specified ligand was injected onto the cells at the 50th repeat measure as denoted by an arrow. Traces represent the mean of 3 independent experiments. E and F, kinetic traces of AT1R conformational biosensors responding to ligand in the presence and absence of G proteins. ΔGαq/11/12/13 cells were transfected with AT1R-ICL3 P3-RLucII and FP-WT (E) or AT1R-ICL3 P3-RLucI, FP-WT, and Gαq (F). The specified ligand was injected onto the cells at the 50th repeat measure as denoted by an arrow. Traces represent the mean of 3 independent experiments.

