Figure 5.

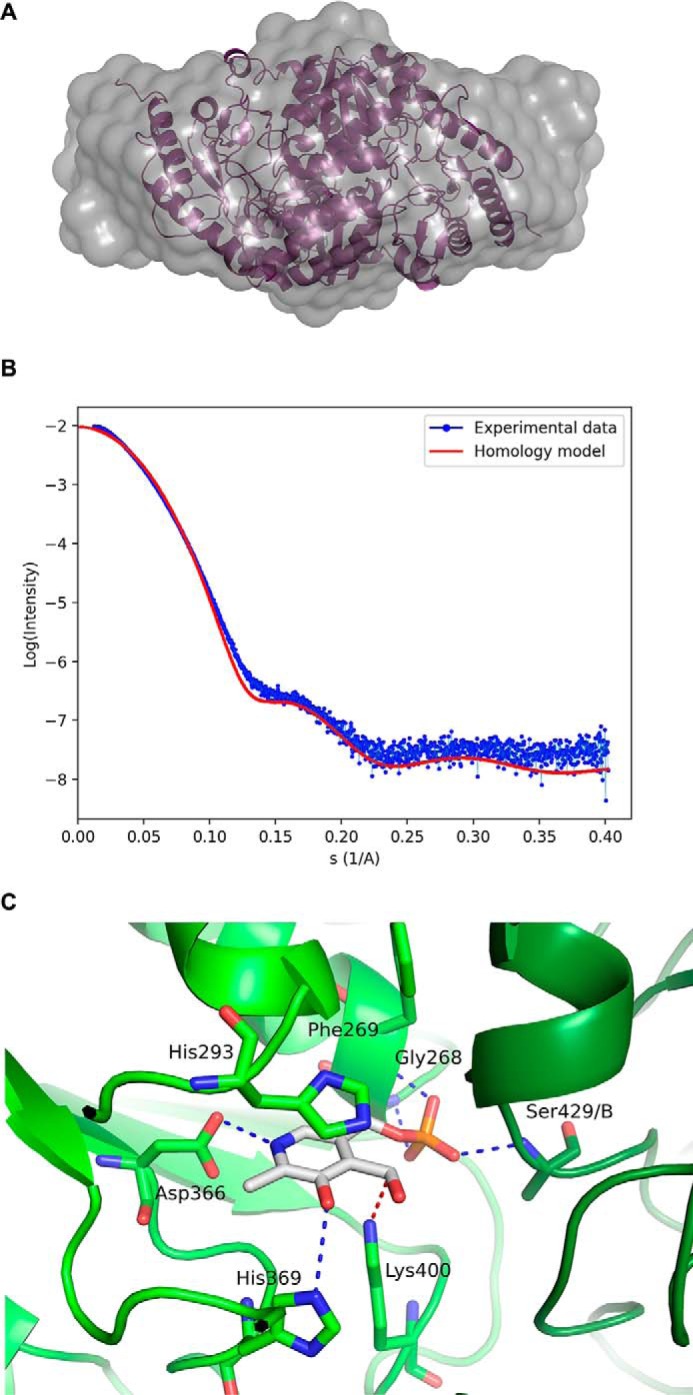
A, SAXS generated envelope overlaying a homology model of the TgSPT1 dimer. B, SAXS data (binned mode as blue dots), superimposed with the calculated scattering curve using the homology mode (in red). C, close-up of the PLP binding site of the homology model of TgSPT1 based on the crystal structure of SPT from S. multivorum. The key PLP binding residues depicted with cyan bonds in a ball-and-stick representation are conserved in the family (see Fig. 2). The numbering corresponds to the TgSPT1 sequence. Note that Ser-429/B belongs to the second subunit of the homodimer.
