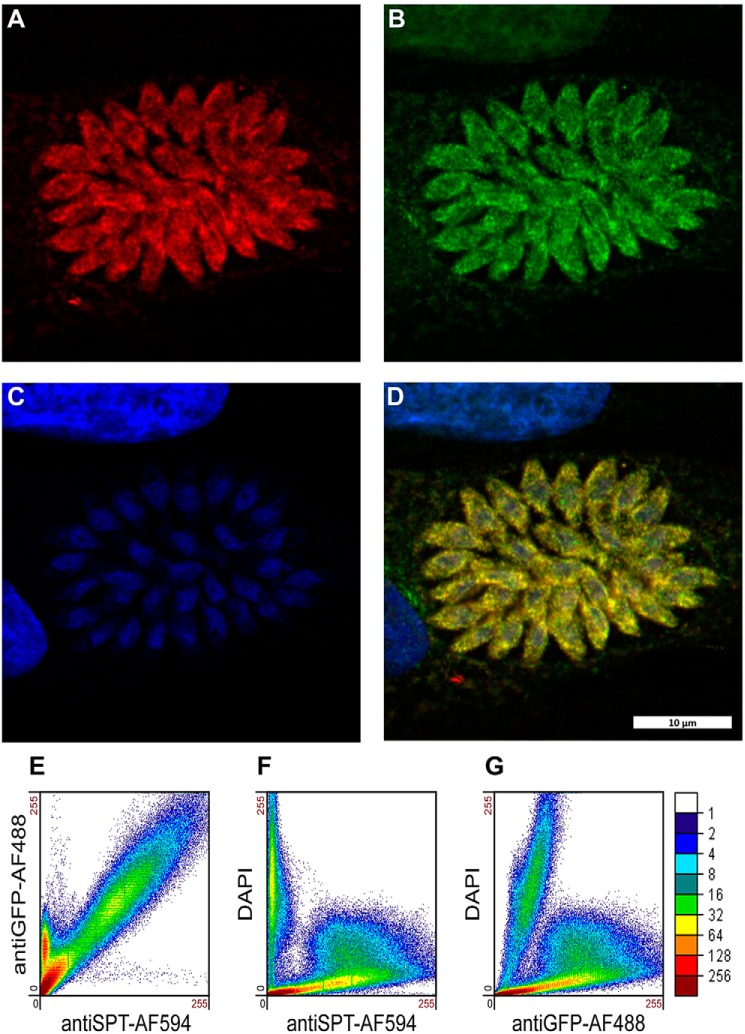
Figure 7.
Endogenous TgSPT1 (A, AlexaFluor594, red) and ectopically expressed ER marker GFP-HDEL (B, AlexaFluor488, green) co-localize as shown in the merged image (D, yellow). The scale bar is equivalent to 10 μm. In support of this, the scatterplot (E) demonstrates the strong correlation of TgSPT1 (antiSPT-AF594) with GFP-HDEL (antiGFP-AF488). In contrast, neither TgSPT1 (antiSPT-AF594) nor GFP-HDEL (antiGFP-AF488) show any significant correlation with DAPI-stained (C) nuclei (F and G). The color scale represents the number of pixels as indicated.

