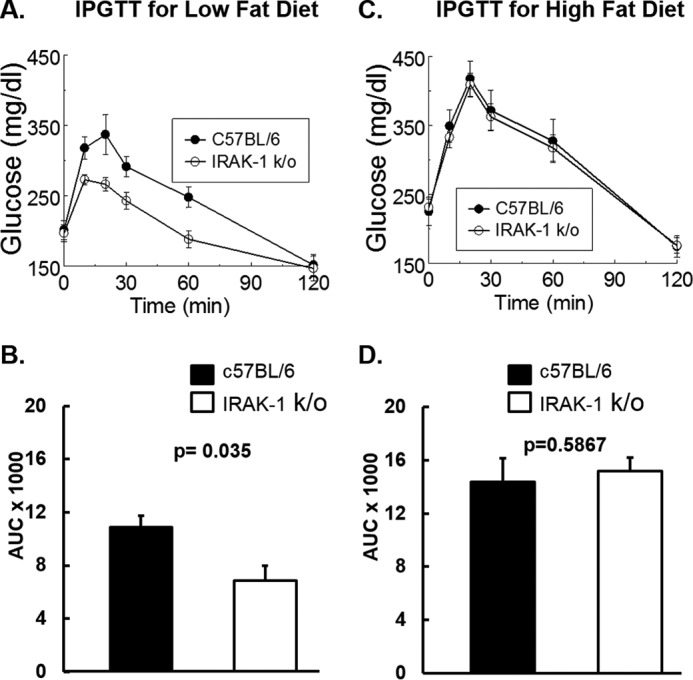
Figure 1.

Intraperitoneal glucose tolerance tests (IPGTT) are shown. A–D, 6-week-old wild-type and Irak1 k/o mice were fed with either low-fat (A and B, n = 8) or high-fat diets (C and D, n = 8). After 12 weeks on the designated diets, mice were fasted for 5 h. Glucose (1 g/kg) was injected intraperitoneally and blood glucose was measured at 0, 10, 20, 30, 60, and 120 min after injection. B and D, areas under the curve (AUC) were calculated based on the trapezoidal rule. A, ANOVA for repeated measures, p = 0.004. B, AUCglucose = 10890 ± 840 versus 6850 ± 1100 (mg/dl) × min), p = 0.035. C, ANOVA for repeated measures, p = 0.56. D, AUCglucose = 14370 ± 1800 versus 15180 ± 1040 (mg/dl) × min), p = 0.59. Data are expressed as mean ± S.E.
