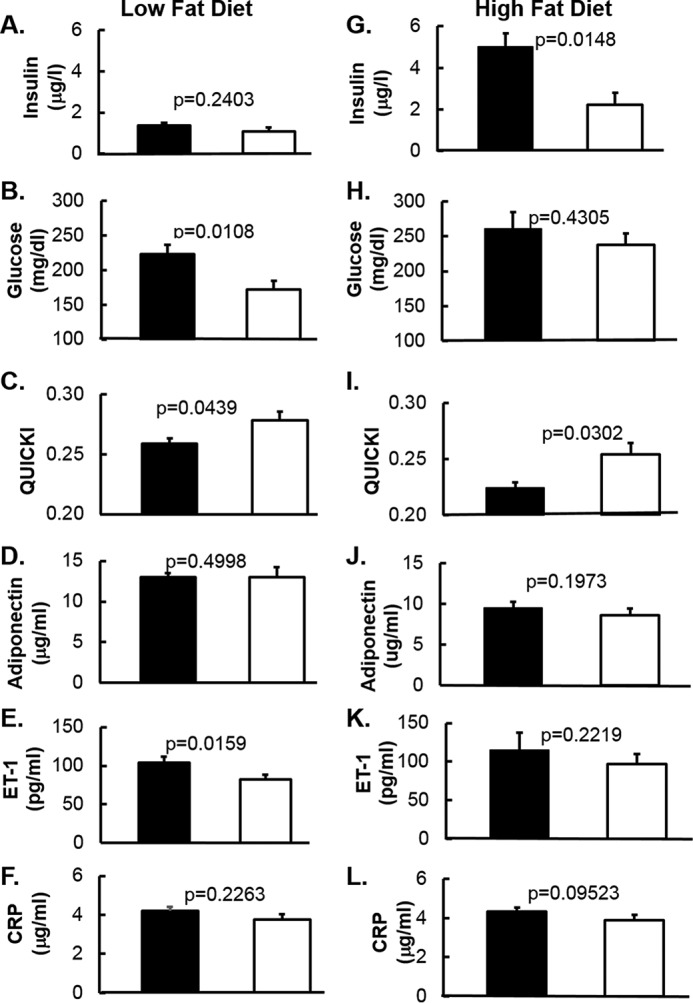
Figure 3.

Cardiometabolic biomarkers in mice fed with low-fat diet and high-fat diet are shown. A–L, fasting plasma was obtained after 14 weeks on low-fat diet (A–F) or high-fat diet (G–L). B and H, glucose was measured by YSI 2700 Select Biochemistry Analyzer. Insulin (A and G), adiponectin (D and J), ET-1 (E and K), and CRP (F and L) were measured by ELISA. C and I, QUICKI was calculated as QUICKI = 1/(log (insulin) + log (glucose)) (55, 56, 100). Data are expressed as mean ± S.E.
