Figure 2.
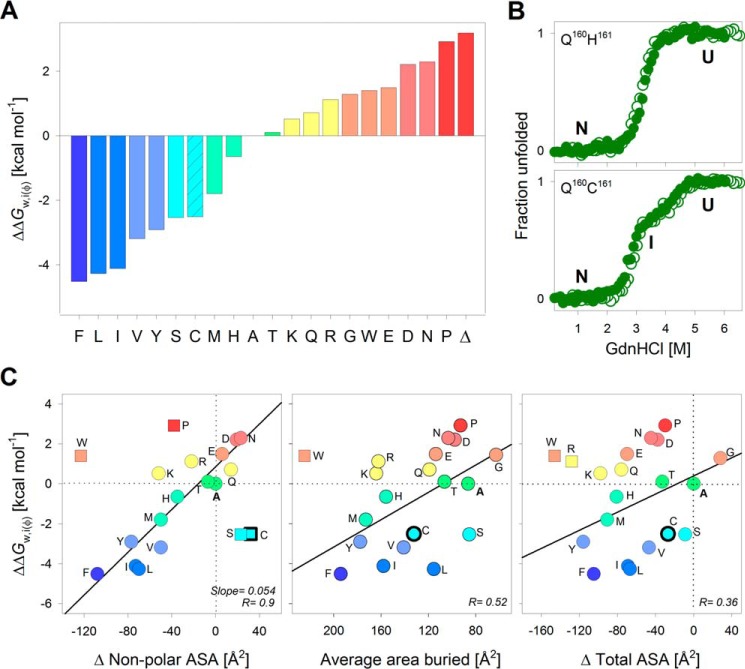
Interface energetic contributions of the PagP terminal lipid-facing residue depends on non-polar ASA. A, water-to-interface partitioning free energy calculated for all 20 residues at the lipid-facing amphiphilic position 161, normalized with respect to alanine. Amino acids are represented by their single-letter codes; Δ, PagP-ΔF161. Histograms are colored from blue to red in decreasing order of ΔΔG0w,i(φ). PagP-C161 showed a three-state folding profile (shown in B), and the free energy change for the more distinct transition (ΔG0I→N; patterned fill in histogram) is used here for comparison. B, chemical denaturation profiles exhibit no hysteresis, as seen from the overlay of folding (open circles) and unfolding (filled circles) profiles for two representative mutants. See supplemental Figs. S3 and S4 for the complete data. The ΔG0 derived from the folding titrations was used to calculate the partitioning free energies shown in A. C, correlations between ΔΔG0w,i(φ) and empirical parameters describing the change in ASA for each amino acid are presented as scatter plots. Linear fits to the correlation are shown as solid lines. Values excluded from the fits are shown as square symbols. Variants with three-state profiles are shown as symbols with thicker edges. The best correlation was observed with the change in non-polar ASA (left). Other parameters, such as average area buried upon folding (middle) and change in total ASA (right) do not correlate well with the interface partitioning free energy. The color code for the scatter plots is retained from A.

