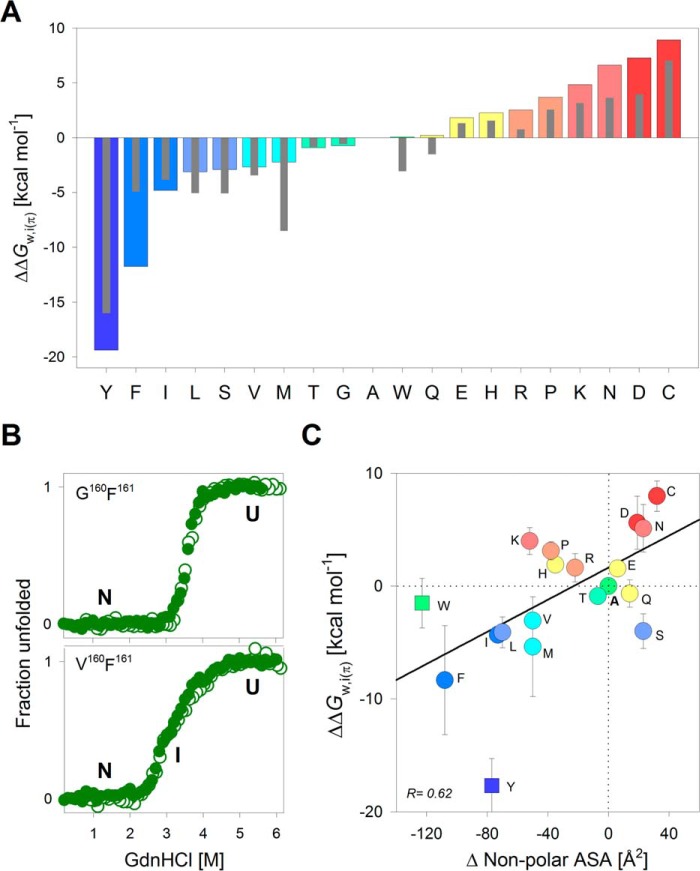
Figure 3.
Skewed polarity for partitioning of penultimate protein-facing interface residue of PagP. A, water-to-interface partitioning free energy values calculated for all 20 residues at the protein-facing hydrophilic interface position 160, normalized with respect to alanine. Colored bars and thin gray bars represent the free energies generated from the PagP-X160F161 and PagP-X160L161 mutant libraries, respectively. Histograms are colored from blue to red in decreasing order of partitioning free energy values for PagP-X160F161. B, representative equilibrium chemical denaturation profiles showing overlay of folding (open circles) and unfolding (filled circles) curves for two mutants (see supplemental Figs. S3 and S6 for the complete data). C, correlation between ΔΔG0w,i(π) and the change in non-polar ASA is shown as a scatter plot. ΔΔG0w,i(π) values are averaged from PagP-X160F161 and PagP-X160L161 mutant libraries (error bars represent deviation from this average). Linear fits to the correlation are represented as solid black lines. Points that are excluded from the fits are shown as square symbols. The color code for the scatter plots is retained from A. Also see supplemental Fig. S9.

