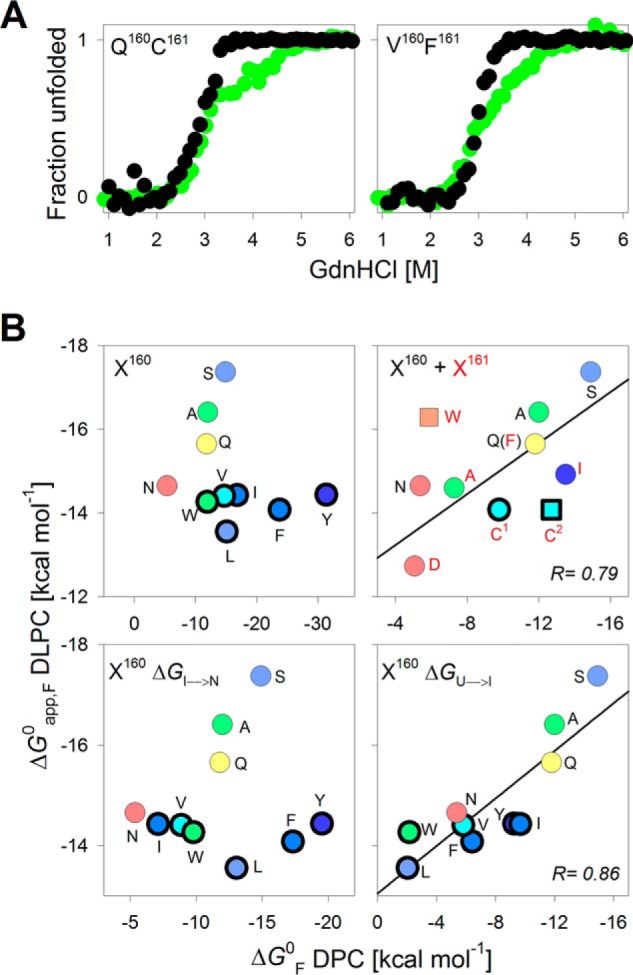
Figure 4.

Energetics in DLPC demarcate the two transitions observed for PagP-X160 mutants with hydrophobic substituents. A, overlay of representative folding profiles for two PagP variants that exhibit three-state equilibrium folding transitions in 10 mm DPC (green) and the corresponding data in 0.8 mm DLPC (black). B, scatter plots correlating the ΔG0 of PagP in DPC and ΔG0app,F in DLPC. The Xaa161 mutants (red) and the Xaa160 mutants (black) are represented by their single-letter codes. Variants with three-state profiles in DPC are shown as symbols with thick edges. Along the x axis, the two upper panels depict the total ΔG0 (ΔG0U→N for the two-state transitions or ΔG0U→I +ΔG0I→N for the three-state transitions) determined for PagP-X160 mutants in DPC micelles. Along the x axis, the two bottom panels show ΔG0I→N (left) and ΔG0U→I (right) for the three-state transitions in DPC micelles and are presented along with the ΔG0 (DPC) for the two-state transitions. Linear fits to the correlation are represented as solid black lines. A good correlation (r = 0.79) is observed between ΔG0 (DPC) and ΔG0app,F (DLPC) only for the PagP-X160 and PagP-X161 mutants showing a two-state transition (top right). The total ΔG0 in DPC of PagP-C161 is split into ΔG0I→N (C1) and ΔG0U→I (C2).
