Figure 5.

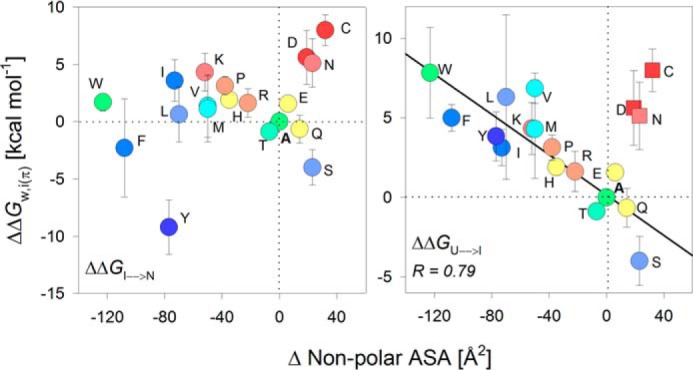
Partitioning free energy at the protein-facing interface correlates inversely with the change in non-polar ASA of the guest residue. Correlation plots were generated by mapping the change in non-polar ASA with the total change in folding free energy ΔΔG0U→N for the PagP-X160 mutants that exhibit two-state profiles. The plot also includes the ΔΔG0w,i(π) for the PagP-X160 mutants exhibiting three-state folding profiles (W, Y, F, L, I, V, and M) divided into ΔΔG0I→N (left) and ΔΔG0U→I (right). A linear (inverse) fit with a high regression coefficient (solid line; r = 0.79) could be obtained only when the ΔΔG0U→I was considered (right). Points that are excluded from the fits are shown as square symbols. The color code for the scatter plots is retained from Fig. 3A.
