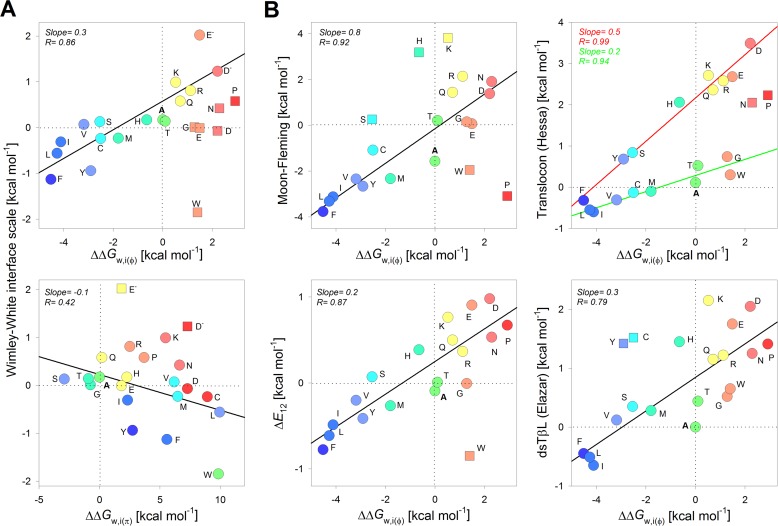
Figure 7.
Comparison of interface energetics for PagP β-signal residues with previously reported scales. A, correlation plots generated by comparing the ΔΔG0w,i(φ) (derived from the lipid-facing interface position; top) and the ΔΔG0w,i(π) transfer free energy (derived from the polar protein-facing interface position; bottom) with the Wimley–White interface scale (12). Here, the ΔΔG0w,i(π) scale is derived from the ΔΔG0U→I (W, Y, F, L, I, V, and M) or ΔΔGU→N observed at the penultimate residue. B, comparison of ΔΔG0w,i(φ) with the whole-protein (7), translocon (9), ΔE12 (13), and dsTβL (11) scales. Linear fits to the correlation are represented as solid lines. Points excluded from the fits are shown as square symbols. Color codes for residues are retained from Fig. 2A for ΔΔG0w,i(φ) and Fig. 3A for ΔΔG0w,i(π). The slope and corresponding regression coefficients are indicated within each panel and are color-coded for the fits to the translocon scale in B.

