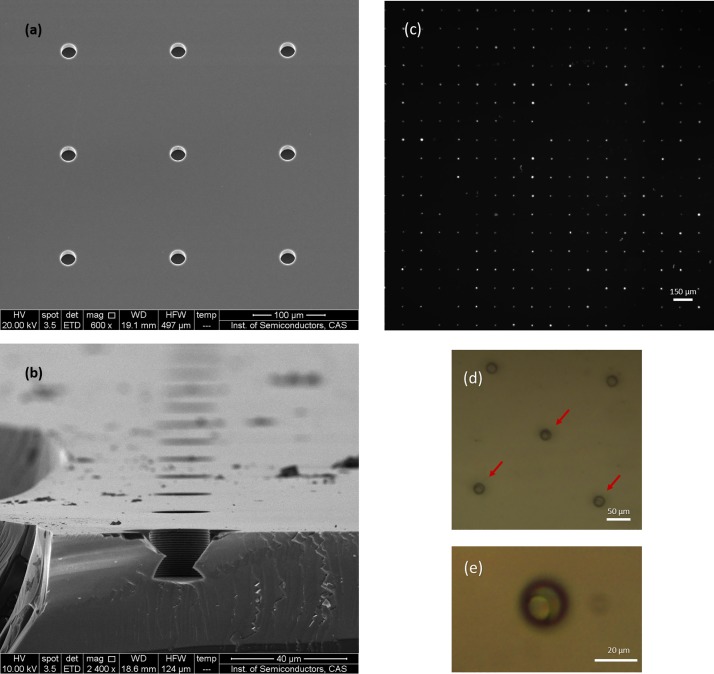
FIG. 3.
Scanning electron microscope (SEM) image of the cell-sized well array (a) and cross-sectional view (b) of a single well. Fluorescence and bright-field images of cells captured in the micro-well array. (c) The bright spots represent cells in the wells. Image (d) and (e) show bright-field images of single cells in individual micro-wells. Owing to the space limitation of cell-sized well, only one cell can be trapped. Image (e) shows the cell with a well integrative morphology.

