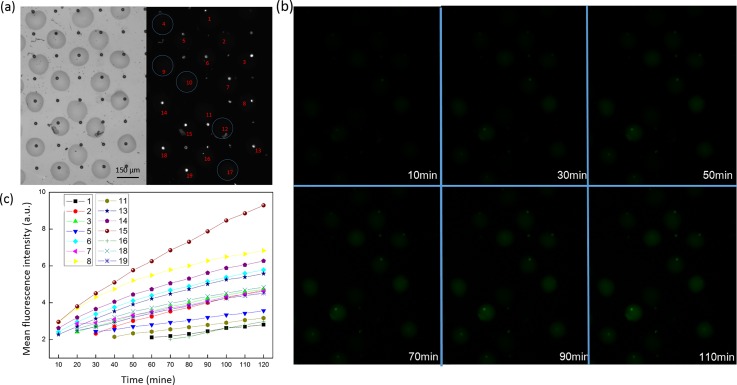
FIG. 6.
Single cell enzymatic assay of K562 cells using ODOAS. Bright-field and fluorescence images (a) determined the presence of a cell in an enzymatic detection solution. We generated 19 droplets using our sequential-inkjet printing technology. Of these, five wells (4, 9, 10, 12, and 17) without cells are circled in blue. The trapped cells were lysed inside the wells in the presence of FDG. (b) Post-lysis fluorescence images of the wells were acquired using a green emission filter (515 nm) to monitor the presence of the fluorescent product (fluorescein) from FDG hydrolysis by intracellular β-gal. (c) Kinetics of the average fluorescence intensity from the wells containing a cell.

